Yards Per Play And Third Down Differentials: Another Visit
YARDS PER PLAY AND THIRD DOWN DIFFERENTIALS: AN UPDATE
In diaries in the past, we’ve talked about how yards per play differentials and third down differentials seem to be reasonably well correlated to a team’s overall success. For the most part, win these battles and you will likely win the game. It is in looking at these numbers for Michigan’s season to date that a couple interesting things seem to appear actually.
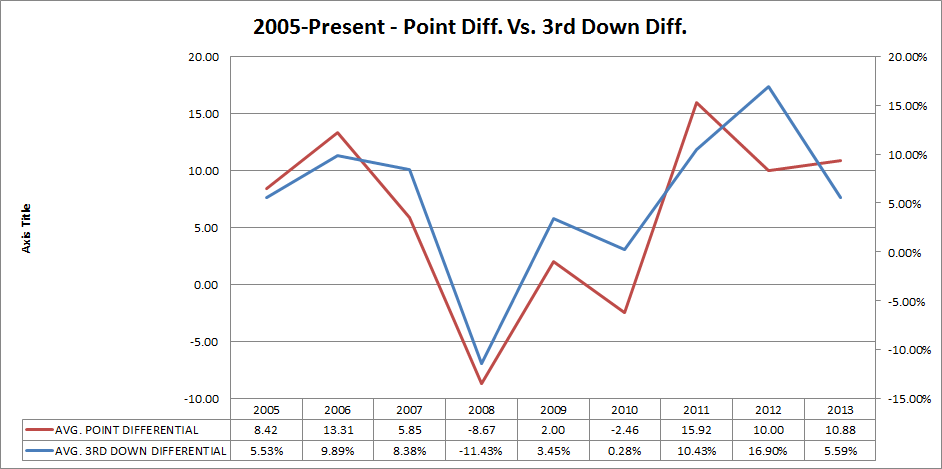
We’ll start with third down differentials compared to win / loss margin. The summary of the last eight seasons plus this season to date is below:
It looks as if 2011 onwards has something interesting happening, right? I looked at the overall R-value for the 109 games played since the start of 2005, and it is 0.706, which is perhaps not the best but respectable as football goes. One thing that is sort of intriguing is that, if you break the first two plus seasons under Hoke into separate groups, you find:
|
YEAR |
R-VALUE |
|
2011 |
0.730 |
|
2012 |
0.733 |
|
2013 |
0.771 |
Of course, the seasons in isolation are smaller populations, so it has to be interpreted in that light, but the trend here of third down differential becoming increasingly tied to win-loss margin under Hoke is interesting, I would think.
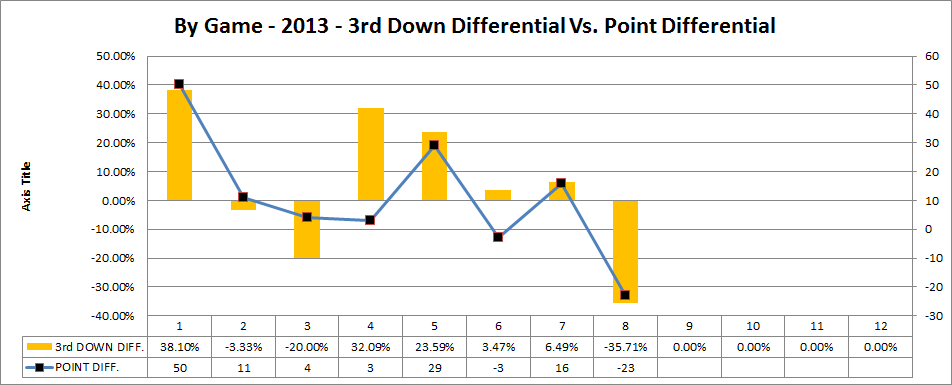
Here is the graph of third down differentials and score margin for this season to date:
A bit of trivia here – that -35.97% third down differential is not Michigan’s worst performance on this metric in the last eight or so years. It is the second worst actually, but it is in the end merely one game. The worst (-36.97%) actually belongs to the 2008 Ohio State game, which ended a very painful season indeed. The chances based on data from the last 109 games of Michigan having such a deficit here? About 3%, so we do have that – it isn’t likely to happen often.
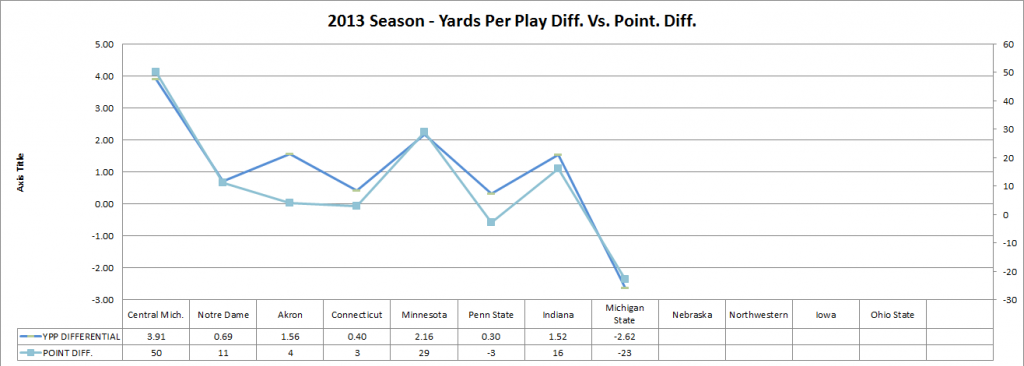
The yard per play differentials this season, when compared to score margin, tell a similar story:
The thing that strikes me is that we’ve only been outgained once, although we have had three games where the differential was a yard or less. In the Penn State game, which has the smallest positive margin, we lost by three. Perhaps that is an indicator that in those scenarios where the differential is close to zero, predictability goes out the window.
To add, here is the progression so far of average plays per game, yards per play and average margin under Hoke:
|
YEAR |
AVG. NO. OF PLAYS /GAME |
AVG. YPP. |
AVG. YPP DIFF. |
AVG. MARGIN |
|
2011 |
64.92 |
6.29 |
1.17 |
15.92 |
|
2012 |
63.08 |
6.11 |
1.11 |
10.00 |
|
2013 |
68.00 |
6.02 |
0.99 |
10.88 |
The table tells a small but intriguing tale really – we are averaging more plays but not quite getting as far with them. We’ve talked about it a lot on the boards, of course, but there it is. Interestingly, the average score margin has stayed somewhat stable from last year into this one.
I don’t really have a definite conclusion here. This team is a work in progress and will be for a bit longer perhaps. I simply find these numbers / beginnings of trends (I hesitate to call them “trends” right now) kind of interesting.
November 5th, 2013 at 1:50 PM ^
but I simply cannot remember a season with more negative plays on offense than 2013. Yet when you look at AVG YPP in 2013 vs. 2012 it just doesn't correspond. Although I also believe we've have many more big passing plays in 2013 than either 2012 or 2011, which perhaps explains some of that. Does anyone have any statistics regarding the number of negative plays (ave per game) for each of Hoke's teams?
Go Blue!
November 5th, 2013 at 5:34 PM ^
2008 might have exceeded this year for negative plays, but that's bad company to be in.
We definitely have a lot more big passing plays than we did last year. Denard didn't get that many passing yards in general. Our passing game picked up when Devin took over but still wasn't as big-play as it is now.


Comments