What Team Returns the Most on Defense?
This is part 2 of my diaries on returning defense. This is shorter than my other diaries, only dealing with the total returning defense and the total number of returning contributors. In my opinion, the information contained within is much more interesting than the information contained within Part 1.
However, for reference, here’s the first part of the diary on defense: Part 1.
As a side note, I make extensive use of Z-scores in this diary, which are simply standardized scores, representative of how many standard deviations above or below the mean the raw scores are. These scores are helpful in this scenario because they allow us to quantify the difference between teams in each category of returning offense.
Here’s a good resource for more on Z-scores: http://statistics-help-for-students.com/What_are_Z_scores.htm
Now for the fun stuff:
I. Total Returning Defense
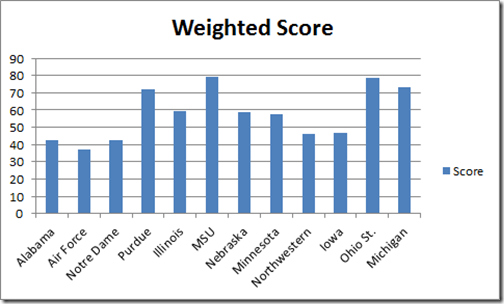
To calculate the total returning defense I gave a 40% weight to returning tackles and a 15% weight to each of returning tackles for loss, sacks, interceptions, and forced fumbles. I believe that the number of returning tackles are more indicative of returning experience than any of the other measurements, hence the added weight given to them in my formula.
| Returning | Weighted Score | Z Score |
| Alabama | 42.40 | -1.03 |
| Air Force | 37.03 | -1.39 |
| Notre Dame | 42.74 | -1.01 |
| Purdue | 71.72 | 0.92 |
| Illinois | 59.51 | 0.11 |
| MSU | 79.31 | 1.43 |
| Nebraska | 58.84 | 0.07 |
| Minnesota | 57.44 | -0.03 |
| Northwestern | 46.39 | -0.76 |
| Iowa | 46.85 | -0.73 |
| Ohio St. | 78.77 | 1.39 |
| Michigan | 73.15 | 1.02 |
| Weighted Score | |
| Mean | 57.84 |
| Standard Error | 4.34 |
| Median | 58.14 |
| Standard Deviation | 15.02 |
| Sample Variance | 225.59 |
| Range | 42.28 |
| Minimum | 37.03 |
| Maximum | 79.31 |
Top 3 Returning Defenses
1. MSU
2. Ohio St.
3. Michigan
Worst 3 Returning Defenses
1. Air Force
2. Alabama
3. Notre Dame
Teams on the schedule return an average of 57.84% of their defense from last year, σ=15.02. The minimum value for returning defense is 37.03%, while the maximum value for returning defense returns 79.31%.
MSU (79.31%, z=1.43) returns the most on defense, followed closely by Ohio St. (78.77%, z=1.39). Michigan follows behind MSU and Ohio St. (73.15%, z=1.02).
Air Force returns just 37.03%, z=-1.39, of their defense from last year. Alabama follows behind Air Force, returning 42.40%, z=-1.03, of their defense from last year. Notre Dame narrowly beats out Alabama returning 42.72%, z=-1.01.
II. Returning Contributors
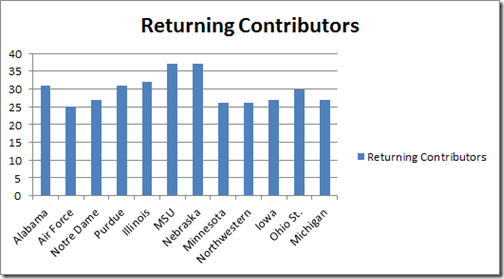
When looking at these numbers, keep in mind that I did not adjust for total number of contributors on defense last year, special team tackles, or offensive tackles on turnovers. You’ll notice that the number of returning contributors is only loosely correlated with returning defense.
| Returning Contributors | Z Score | |
| Alabama | 31 | 0.32 |
| Air Force | 25 | -1.13 |
| Notre Dame | 27 | -0.65 |
| Purdue | 31 | 0.32 |
| Illinois | 32 | 0.57 |
| MSU | 37 | 1.78 |
| Nebraska | 37 | 1.78 |
| Minnesota | 26 | -0.89 |
| Northwestern | 26 | -0.89 |
| Iowa | 27 | -0.65 |
| Ohio St. | 30 | 0.08 |
| Michigan | 27 | -0.65 |
| Returning Contributors | |
| Mean | 29.67 |
| Standard Error | 1.19 |
| Median | 28.50 |
| Mode | 27.00 |
| Standard Deviation | 4.12 |
| Sample Variance | 16.97 |
| Range | 12.00 |
| Minimum | 25.00 |
| Maximum | 37.00 |
Top 3 Teams with the Most Returning Contributors
1a. MSU
1b. Nebraska
2. Illinois
The 3 Teams with the Fewest Returning Contributors
1. Air Force
2a. Minnesota
2b. Northwestern
Teams on the schedule return an average of 29 contributors on defense, σ=4.12. The minimum number of returning contributors is 25 while the maximum number of returning contributors is 37.
MSU and Nebraska both return 37 contributors on defense, z=1.78. Illinois returns 32 contributors, z=0.57.
Air Force returns the fewest number of contributors on defense, returning 25 contributors, z=-1.13. Minnesota and Northwestern both return 26 contributors, z=-0.89.
Michigan returns 27 contributors on defense, z=-0.65.
As always, any comments, questions or constructive criticisms are appreciated.
This site is amazing. I am inundated with all of the knowledge and statical data that everyone uses here.
I especially like how you included part II. of the data. Returning starters are so hard to measure, because it does not take into account all of the returning contributing players. Interesting to see how Bama is one of the lowest teams in terms of returning starters, but yet one of the highest in regards to contributing players.
August 9th, 2012 at 10:08 AM ^
Make sure you don't accidentally sign into your other account, WolverineBag.
I will try not to, haha.
August 9th, 2012 at 10:48 AM ^
Anyone who thinks MSU will fall off a cliff this year is nuts. OSU will be a good too. Tough year to win a B10 title. Oh well, we'll just have to do it anyway.
You're right. They won't. And if we are strictly talking defensee, they have the potential to be better than last year.
But that doesn't mean the team will win 11 games again either. Last year they did it with an aggressive defense and an efficient, balanced MANBALL offense. I hate to say it--because saying it makes me feel dirty--but that's pretty much the model we used in the mid-90s, to great effect.
This year they still have the defense, but the offense is questionable. Baker gone, and he was the one who gashed us last year. Cousins gone, and we all know how difficult he made things for us over the years. Whole receiving corps gone, and again, we know how tough they were to cover.
For me, the best Michigan analogy would be 1995. Great defense; mediocre offense headed by a first-year starter. We went 8-3 in the regular season that year, and were dangerous, but we weren't great either.
I think we beat MSU this year, and I think they drop a couple others as well. But they also knock off a good team or two along the way to an 8 or 9 win season.
August 9th, 2012 at 12:04 PM ^
we're looking good superficially and--aherm--a bit less so when you dig? Don't worry, the pundicrappacy will rank us high then hand out the usual shite about our being over-rated when and if we fail.
Still think we might just could possibly (insert other conditionals here) sneak up on Bammy.
They also lose more than Air Force does.
Good analysis. Have you ever looked at Phil Steele's experience chart? He does something very similar to this analysis. Can be found here.
It would be interesting to somehow incorporate recruiting rankings into this because there is 0% chance Alabama is the 2nd worst defense we face. They definitely are just reloading with 4/5 stars. Something to think about.
August 10th, 2012 at 1:38 PM ^
August 11th, 2012 at 3:55 PM ^
Sounds good. I've actually done a few blog posts on returning starters and it seems pretty much no matter which way you slice it, returning starters as a whole doesn't matter much.
I agree that incorporating recruiting rankings is the only way to properly predict because more and more teams have stud incoming freshman or talented backups waiting their turn to start.
If you are interested, you can find the first post here. I am working on part II using Phil Steele's experience charts now and plan to analyze the effect of returning quarterbacks as well.


Comments