Week #5 Statistics and FEI Prediction for Purdue
What The What?: The FEI computers were apparently very impressed with Ms bye week as we improved to a ranking of #23 (from #42 last week) and FBS mean wins jumped to 7.5 (it was just 5.8 last week)!? This appears to be the result of adjustments being made due to strength of schedule (SoS). Michigan's SoS is now #4.
Prediction for Purdue: The FEI Forecast for this Saturday is Purdue 24 – Michigan 16 with a 71% Probable Win Expectation for Purdue. FEI is wrong this week and Michigan lets Denard be Denard: Michigan 35 – Purdue 17.
Purdue is ranked #15 in the FEI and has a strength of schedule (SoS) of #43. As you can see from the detailed FEI chart below, M is ranked 39 positions better for SoS, 21 positions better for offense, and 4 positions better for defense versus Purdue. Purdue has beaten an FCS team (Eastern Kentucky), Eastern Michigan (#92 FEI), and Marshall (#87 FEI). M's tougher schedule is what makes the difference in this game.
Fremeau Efficiency Index: The FEI is a drive based analysis considering each of the nearly 20,000 drives each year in FBS college football. The data is filtered to eliminate garbage time (at the half or end of game) and is adjusted for opponent. A team is rewarded for playing well against good teams (win or lose) and is punished more severely for playing poorly against bad teams than it is rewarded for playing well against bad teams.
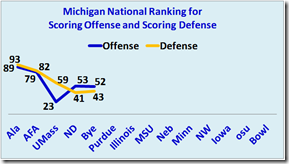
 National Rankings: The rankings for offense and defense are based on scoring (yardage statistics are inherently flawed). These are simply raw numbers without any adjustments for opponent, garbage time, or anything else. The data is from TeamRankings and includes only games between two FBS teams.
FEI Details: Here are the FEI numbers for Michigan ( Football Outsiders FEI ). 
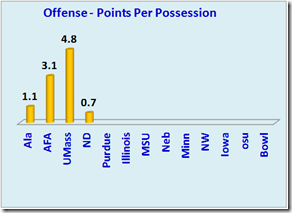
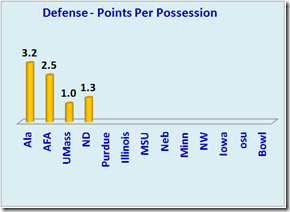
 Points Per Possession: The 2 charts show the raw data for offense and defense with the number of possessions adjusted for "kneel downs" at the half or end-of-game (maximum deduction = 2). The charts both indicate significant improvement in each subsequent game. Of course, this may be due in great measure to the fact that the opponent has been weaker in each subsequent game.
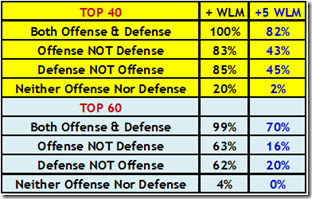
Using Scoring Offense and Scoring Defense National Rankings for the past 5 years (FBS AQ teams only), this table shows the percentage of teams that finish the season with a +WLM and a +5 WLM. For example, teams that finished in the Top 40 in both offense and defense had a 100% chance to be +WLM and an 82% chance to be +5 WLM (9-4 or better).
October 3rd, 2012 at 3:14 PM ^
Purdue was +3 in turnovers against Marshall with two picks being returned for TDs.
The folks at FEI calculated a 10 point loss by Purdue against Marshall without the TOs.


Comments