Week #4 National Rankings and Sagarin Predictor for Indiana
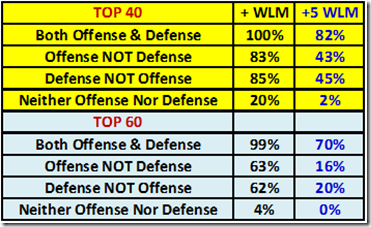
Synopsis: After 4 games, Michigan is currently ranked #11 in scoring offense and #64 in scoring defense. Based on these rankings, M has a 43% chance for a +5 WLM (9-4 or better) season and an 83% chance for a winning season. Note that if Defense rankings improve just slightly to the Top 60, the probability of a +5 WLM increases to 70%. Offense continues to trend better each week. Defense improved slightly. (See line chart below)
Expect a close game this week with lots of passing from Indiana (the one cavaet is that Indiana has played a very weak schedule [Towson (FCS and #195), W. Kentucky (#144), and Akron (#175)] and a bye week so data is minimal). Also, Indiana is ranked #92 in rushing defense which could be disastrous for Indiana.
Based on the Sagarin Predictor M is favored by 10.7 points in the Indiana game (Vegas Odds Opened at 10.5). Notice that the three Sagarin odds are very close to one another this week. That is to be expected as M finally won a game by a large margin which has brought the Predictor closer to the EloChess.
(For a Monte Carlo simulation analysis see The Mathlete's Diary which will be posted later this week.)
DETAILS: Here are the Sagarin Ratings. I have added "Opps Rank" which is the total rankings of the opposition played divided by the number of teams played.
Sagarin uses two basic ratings: PREDICTOR (in which the score MARGIN is the only thing that matters) and ELO-CHESS (in which winning and losing only matters, the score margin is of no consequence). The overall rating is a synthesis of the two diametrical opposites, ELO-CHESS and PREDICTOR.
Per Sagarin: ELO-CHESS is “very politically correct. However, it is less accurate in its predictions for upcoming games than is PREDICTOR”.
Here is the U/M vs. Indiana National Statistical Rankings with the advantage for each category indicated (all categories within 10% are considered a "push"). Biggest differences are M rushing O (#2) versus I rushing D (#92) and conversely I passing O (#11) versus M passing D (#105).
Here are the week by week National Statistical Rankings for Michigan (cumulative thru the week indicated):
I have included the major rankings for offense and defense but scoring rankings show the best correlation to winning and losing. Scoring rankings are based on PPG. Rushing, Passing, and Total rankings are based on YPG.
Using Scoring Offense and Scoring Defense National Rankings for the past 5 years (FBS AQ teams only), this table shows the percentage of teams that finish the season with a +WLM and a +5 WLM. For example, teams that finished in the Top 40 in both offense and defense had a 100% chance to be +WLM and an 82% chance to be +5 WLM (9-4 or better).
Each year, of the 66 FBS AQ teams, 65% (43 teams) end up with a + WLM and 36% (24 teams) end up with a +5 WLM.
September 27th, 2010 at 9:59 AM ^
The numbers don't lie...while its important not to get too caught up in rankings the big plays keep hurting us on D and showing up in the overall trend.
I love the 2% of teams which do neither but are +5
Do you know who they were?
September 27th, 2010 at 11:00 AM ^
MSU 2008 (O 53 - D 41) +5 WLM
Maryland 2006 (O 74 - D 51) +5 WLM
September 27th, 2010 at 12:56 PM ^
Hey Life, nice set of diaries. I have actually spent 25 years testing Sagarin's various ranking methods versus the outcomes of the games at the end of the year. While I know Jeff believes his PREDICTOR rankings are the best, I have found year after year, since '85, that his basic RATING column is the best for predicting future games. Now, I found the basic RATING column is only about 5% better than the PREDICTOR column at predicting games, but that is the difference between a 70% winning percentage ATS and a 65% winning percentage.
September 27th, 2010 at 1:53 PM ^
Thanks for the info. I decided to show all three so folks could see the differences between them.


Comments