Week #10 National Rankings and Predictions for Purdue
 Synopsis: Wooo Baby – Now we can all relax! With all the points we scored and all the points they scored, the stats are going to be pretty funky. After 9 games, Michigan is currently ranked #12 in scoring offense and #104 in scoring defense. Without the 20 points allowed in OT, the D would be ranked #97. The 5 TOs put the D in terrible field position and resulted in 17 possessions for Illinois. M allowed 2.6 points per possession in regulation which is actually the best we have done in Big10 play. So, yes, the D played better this week!
I use scoring stats because yardage stats are inherently flawed.  According to the FEI rankings at Football Outsiders, Michigan's defense actually improved and is now ranked #109 (it was #112 last week).
Based on the FEI (Fremeau Efficiency Index), Michigan is ranked #41 overall (7.8% better than the average FBS team) with a SoS ranking of #82. The offense is ranked #1 and the defense is ranked #109. Field Position Advantage is #84 while Field Goal Efficiency is #117.
M is predicted to win between 7.2 and 7.4 games (excluding bowl game but adjusted with +1 for M's one FCS opponent). Based on the FEI, M would have been expected to win 4.8 FBS games to date (we have won 5.0 FBS games to date).
FEI has the game as M 42 - Purdue 20 with a 89.7% predicted win expectation (Purdue has the #113 ranked O and #64 D). Using the Sagarin Predictor, Michigan is favored by 11.7 points. Vegas has M favored by 13.
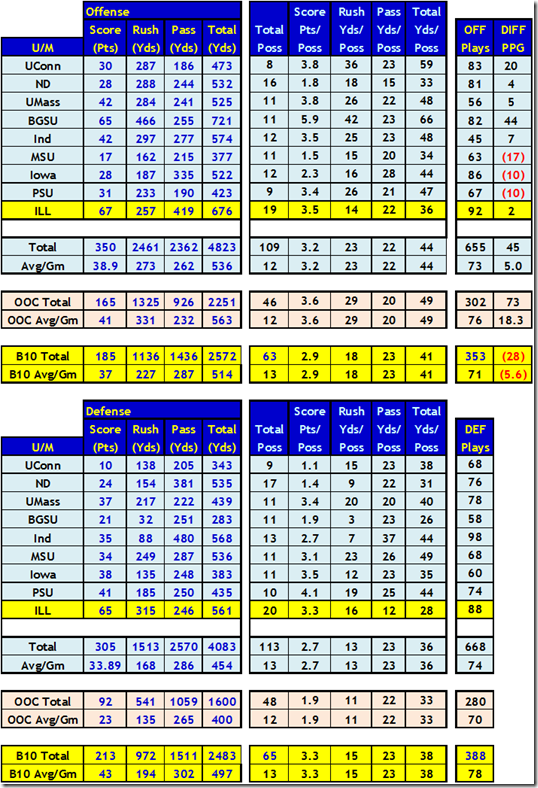
 This line chart differentiates between OOC and Big10 points per possession. Note that the defense PPP did not get worse even including the 6.7 PPP in OT. In the Big 10, M is averaging 2.9 points per possession (PPP) and 41 YPP. The defense is giving up 3.3 PPP and 38 YPP. With an average of 12 possessions per game for each team, this translates into a 4.8 point disadvantage for Michigan. (In OOC games, this was a 20 point advantage.)
For those who want yardage stats, here they are – split by OOC and Big10 games. The good news is that the yardage defense has been pretty consistent for the last 3 games. The bad news is that the defense is consistently horrible.
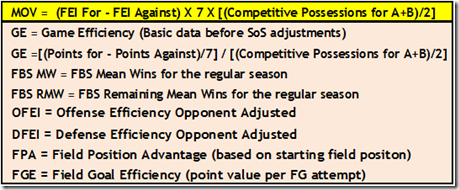
DETAILS: Here are the FEI numbers ( FEI Forecasts and Football Outsiders FEI ). FEI is a weighted and opponent adjusted season efficiency and is expressed as a percentage as compared with an average FBS team. The average team will have an index of approximately 0.00. Teams below average have negative index values.
 Note that FEI completely excludes all non-FBS data (the W-L record is only for FBS games, etc.). Therefore, you need to add 1 to FBS-MW to get the final predicted wins for M this year. Or, if you use FBS-RMW, you need to add 1 to the current W-L record to get the final predicted wins for M this year. BTW, the difference between FBS-MW and FBS-RMW is the number of FBS games each team would have been expected to win to date.
The FEI is a drive based analysis considering each of the nearly 20,000 drives each year in college football. The data is filtered to eliminate garbage time (at the half or end of game) and is adjusted for opponent. A team is rewarded for playing well against good teams (win or lose) and is punished more severely for playing poorly against bad teams than it is rewarded for playing well against bad teams. I've included the GE basic data so you can see the impact of adjusting for opponent. (See: Football Outsiders Our Basic College Stats )
Here are the Sagarin Ratings.
Sagarin uses two basic ratings: PREDICTOR (in which the score MARGIN is the only thing that matters) and ELO-CHESS (in which winning and losing only matters, the score margin is of no consequence). The overall rating is a synthesis of the two diametrical opposites, ELO-CHESS and PREDICTOR.
Per Sagarin: ELO-CHESS is “very politically correct. However, it is less accurate in its predictions for upcoming games than is PREDICTOR”.
Here is the U-M vs. Opponent National Statistical Rankings with the advantage for each category indicated (all categories within 10% are considered a "push").
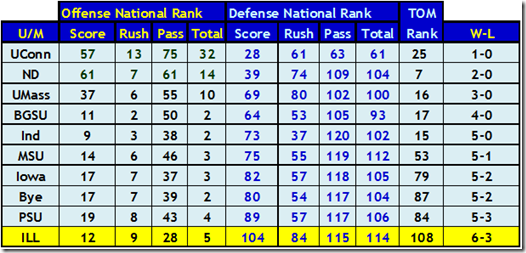
Here are the week by week National Statistical Rankings for Michigan (cumulative thru the week indicated):
I have included the major rankings for offense and defense but scoring rankings show the best correlation to winning and losing. Scoring rankings are based on PPG. Rushing, Passing, and Total rankings are based on YPG.
Here is the basic data for Michigan (each individual week followed by totals and then average per game). I've included Total Possessions for Offense & Defense along with the calculated data per possession. Number of possessions do not include running out the clock at the half or end of game. Offense Plays and Defense Plays are better indicators than Time of Possession.
Using Scoring Offense and Scoring Defense National Rankings for the past 5 years (FBS AQ teams only), this table shows the percentage of teams that finish the season with a +WLM and a +5 WLM. For example, teams that finished in the Top 40 in both offense and defense had a 100% chance to be +WLM and an 82% chance to be +5 WLM (9-4 or better).
Each year, of the 66 FBS AQ teams, 65% (43 teams) end up with a + WLM and 36% (24 teams) end up with a +5 WLM.
November 10th, 2010 at 8:45 PM ^
Could you do a little more research and come up with a few more tables and graphs for us please?
Seriously excellent diary. It will take me several times through this to get it all. Thanks for your time and effort.
November 11th, 2010 at 3:57 PM ^
All of that to say that we are going to be 7-5 or 8-4 at the end of the regular season.
November 10th, 2010 at 8:52 PM ^
Overcome By Events.
I did a diary about national rankings and Win/Loss Margin (WLM) before the season. Then I thought, "hey, I should track this throughout the year". Next came a couple of tables. After that some graphs to summarize the tables and, YIKES, here we are.
November 10th, 2010 at 9:02 PM ^
for all the hard work. Um... me not too bright. Does this mean Michigan win..?
November 10th, 2010 at 9:38 PM ^
This is so excessive. Is this a physics lab report or a mgoblog diary? I can't really tell the difference. In all seriousness though, this is very cool. I really enjoy it.
Not to nitpick, but could you possibly cut down on the acronyms? They get a bit hard to understand especially when you mix in common texting language like BTW (by the way) with uncommon sports lingo like WLM (win/loss margin). Some of the acronyms I don't even know what they are (FEI for example).
November 11th, 2010 at 1:51 PM ^
Great work as always...very humbling.
As far as the acronyms go, why not go with some boilerplate that is embedded in each of these diaries so, once generated, there would only be cut and paste on your part. Ditto for Brian if he reads this...thinking about his UFR's and the acronyms - he does add defs for RPS, but I still have to think hard on some of the tables.
November 11th, 2010 at 2:05 PM ^
Uh, I use a template (as I am sure Brian does also). I may slip up now and again, but every acronym is (should) be defined in the first sentence in which it is used.
I thought about just showing the current week's data but that elimates the possiblilty to compare previous weeks and would actually be more work (for me). I figured folks could just skip to the yellow highlighted data to get the current week's info.
November 10th, 2010 at 10:43 PM ^
So in the end your saying Michigan get's a much needed Big 10 road victory?!? Impressive data, that is for sure.
November 11th, 2010 at 1:13 AM ^
Their 114th ranked Passing Offense vs. our 115th ranked passing Defense. Perhaps this won't be another "Defensive Shoot-Out (thanks, Billy Lynch). Our defense might actually get an interception...but then I'll probably just wake up again.
November 11th, 2010 at 6:36 AM ^
November 11th, 2010 at 8:50 AM ^
Each week this is one of my favorite diaries. Try to pick one area to focus on for the game, this week it will be the Purdue O vs our D. Should be a good match up for us and maybe we get a few more stops. Thank you.


Comments