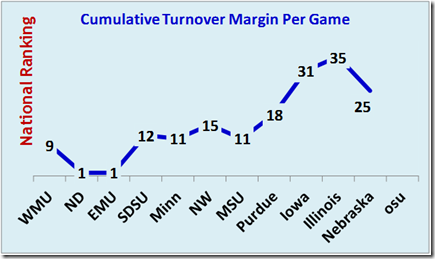
Turnover Analysis Updated Thru Nebraska
The Curve Bends Down!: Michigan's trend of dropping in the the National Rankings for Turnover Margin once B1G games started was brought to an abrupt halt with the +2 TOM against Nebraska. For the first time this year, I am absolutely convinced that once again "This is Michigan for God's Sake!"
Fitzgerald recovered the forced fumble on a KO to add his name to a list that now boasts 19 different defensive players that have either forced a fumble, recovered a fumble, or intercepted a pass!
 Turnover Percentages: Michigan is ranked #4 in takeaway fumble recovery percentage at 83% (M is recovering 83% of the opponent fumbles) and #12 in giveaway fumble recovery percentage at 64% (M is recovering 64% of its own fumbles). Both of these will tend to average around 50% over many years but individual years do experience wide variations. The chart includes only FBS games and is based on data from Teamrankings.
Synopsis for Turnovers: M ended the game with a +2 TOM. For the year, M has had 6 games with a positive TOM, 4 games with a negative TOM and 1 game with a zero TOM. Michigan has lost a total of 20 TOs (ranked #75) but has gained 26 TOs (ranked #11) for a turnover margin of +6 or 0.55 per game (ranked #25). Michigan is ranked #6 in fumbles lost but is #112 in interceptions thrown. The 19 fumbles recovered is ranked #1 and is the reason the turnover margin is excellent instead of horrible.
T. Robinson, Simmons (now with 2), and Ryan all forced a fumble. Avery (now with 2), Fitzgerald, and Van Bergen (now with 3) recovered fumbles. DRob had the screen pass tipped and then intercepted (his 14th).
M blocked their first punt of the year. It was recovered behind the line of scrimmage by Nebraska and could have been advanced for a first down but Michigan's defense came thru once again. BTW, blocked punts are not considered a turnover.
 Synopsis for Expected Point (EP) Analysis: Michigan has a net of 1 game won due to TOs.
(See the Section on Gory Details below for how the adjustment for Expected Points (EP) is calculated.)
National Rankings: Remember the chart and table below includes the WMU game and will NOT be the same as the (incorrect) NCAA Rankings.
The Gory Details
Details for Turnovers: Here is overall summary for all games by player (data in yellow was affected by this week's game).
Expected Point (EP) Analysis: Basically, the probability of scoring depends on the line of scrimmage for the offense. Therefore, the impact of a TO also depends on the yard line where the TO is lost and the yard line where the TO is gained. Each turnover may result in an immediate lost opportunity for the team committing the TO and a potential gain in field position by the opponent. Both of these components can vary dramatically based upon the down when the TO occurred, the yards the TO is returned, and whether the TO was a fumble or an interception.
Here are the details for the game.
The analysis is a bit tricky because: (A) the TO may directly result in lost EP for the offense but (B) only modifies the EP for the team gaining the TO because the team gaining the TO would have gotten another possession even without the TO (due to a punt, KO after a TD, KO after a field goal, etc.). The Net EP Gain must take into account the potential EP gain without the TO. The EP gain without the turnover is based on where the field position would have been for the next possession if the TO had not occurred.
![image_thumb17_thumb_thumb_thumb_thum[2] image_thumb17_thumb_thumb_thumb_thum[2]](https://mgoblog.com/sites/mgoblog.com/files/image_thumb17_thumb_thumb_thumb_thum%5B2%5D_thumb_0.png) The expected point calculations are based on data from Brian Fremeau at BCFToys (he also posts at Football Outsiders). Fremeau's data reflects all offensive possessions played in 2007-2010 FBS vs. FBS games. I "smoothed" the actual data.
The expected point calculations are based on data from Brian Fremeau at BCFToys (he also posts at Football Outsiders). Fremeau's data reflects all offensive possessions played in 2007-2010 FBS vs. FBS games. I "smoothed" the actual data.
Here is a summary of the smoothed expected points.


