Turnover Analysis Updated Thru MSU
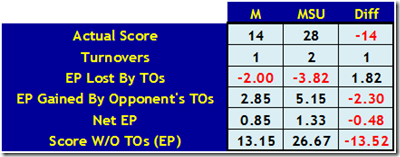
We Didn't Even Win The TO Battle: Although M ended the game with a +1 TOM, the expected point analysis results in a net disadvantage to Michigan. This should not be that surprising since the only TO by Michigan resulted in a return for a TD and this doubled the value for that TO. The 2 TOs gained by M were worth 6.7 expected points but the interception returned for a TD was worth 7.1 expected points for MSU.
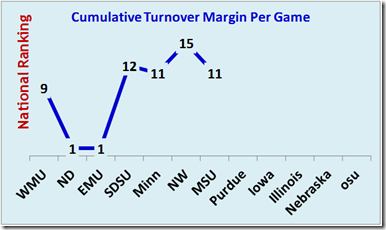
Synopsis for Turnovers: I was at the game and thought the interception was Smith's fault. Denard made the right read for the blitz but Smith did not. After I watched the replay, the announcers were in agreement – but, it will still go down in the stats as an interception for DRob – his 10th. For the year, Michigan has lost 12 TOs (ranked #70) but has gained 19 TOs (ranked #5) for a turnover margin of +7 or 1.00 per game (ranked #11). Michigan is ranked #6 in fumbles lost but is #109 in interceptions thrown. The 14 fumbles recovered is ranked #1 and is the reason the turnover margin is excellent instead of horrible.
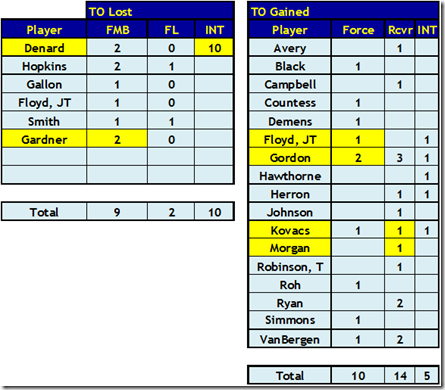
Morgan added his name to the takeaway list with a fumble recovery. There are now 17 different defensive players that have either forced a fumble, recovered a fumble, or intercepted a pass. Thomas Gordon forced another fumble and now has forced 2 fumbles, recovered 3, and intercepted a pass to lead all players in takeaways.
 Synopsis for Expected Point (EP) Analysis: Obviously, when the winning team has a negative TOM, turnovers did not impact which team won the game.
(See the Section on Gory Details below for how the adjustment for Expected Points (EP) is calculated.)
National Rankings: Remember the chart and table below includes the WMU game and will NOT be the same as the (incorrect) NCAA Rankings.
The Gory Details
Details for Turnovers: Here is overall summary for all games by player (data in yellow was affected by this week's game).
Expected Point (EP) Analysis: Basically, the probability of scoring depends on the line of scrimmage for the offense. Therefore, the impact of a TO also depends on the yard line where the TO is lost and the yard line where the TO is gained. Each turnover may result in an immediate lost opportunity for the team committing the TO and a potential gain in field position by the opponent. Both of these components can vary dramatically based upon the down when the TO occurred, the yards the TO is returned, and whether the TO was a fumble or an interception.
Here are the details for the game.
The analysis is a bit tricky because: (A) the TO may directly result in lost EP for the offense but (B) only modifies the EP for the team gaining the TO because the team gaining the TO would have gotten another possession even without the TO (due to a punt, KO after a TD, KO after a field goal, etc.). The Net EP Gain must take into account the potential EP gain without the TO. The EP gain without the turnover is based on where the field position would have been for the next possession if the TO had not occurred.
 The expected point calculations are based on data from Brian Fremeau at BCFToys (he also posts at Football Outsiders). Fremeau's data reflects all offensive possessions played in 2007-2010 FBS vs. FBS games. I "smoothed" the actual data.
Here is a summary of the smoothed expected points.
October 18th, 2011 at 2:56 PM ^
Speilman made a comment about how State was just trying to make "big" hits rather than tackling the ball carriers. He said by wrapping up you could create turnovers. Based on our fumbles recovered stat ... I would say our tackling fundamentals have improved significantly!
Go Blue!
October 19th, 2011 at 10:09 AM ^
Yes, IMHO turnovers are a sympton and NOT a cause. Good defenses create more turnovers -- turnovers do not create good defense.
I believe we are getting more TOs because the defense has improved significantly.
And, luck has virtually nothing to do with TOs.
October 18th, 2011 at 9:05 PM ^
pleased with Thomas Gordon and his play at safety so far this year. Hard to believe that he was a 2 star and the #115 ranked safety in HS. Also, he really never even played defense until his senior year in HS.


Comments