Statistical Review Of Week 1 In The Big Ten - Averages And Extremes
I thought that it might be appropriate to give a brief statistical summary of the ups and downs of the Big Ten in its inaugural weekend for 2013, and there were some interesting extremes. Granted, the averages for 12 games aren’t terribly meaningful, but they are interesting to look at all the same.
THE CONFERENCE ON OFFENSE:
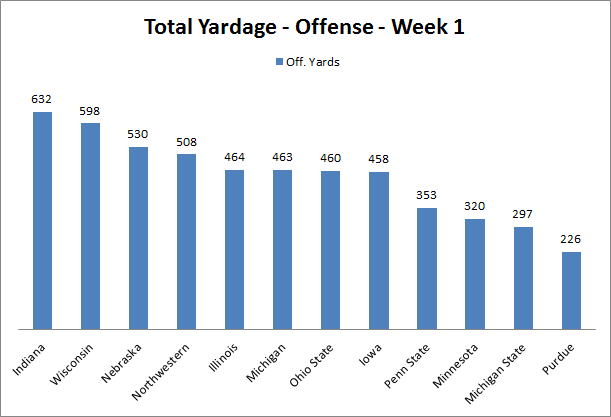
The average performance in the Big Ten on offense was a fairly balanced attack – 214 passing yards and 228 rushing yards over an average of 71 plays. That’s good for 6.23 yards per offensive snap.
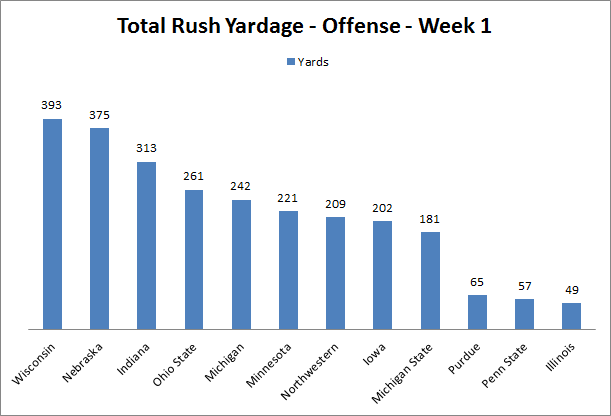
The most prolific rushing attack in the first week belonged to Wisconsin, which put 393 yards rushing up against Massachusetts, followed closely by Nebraska’s 375 yards rushing against Wyoming. The more paltry rushing numbers belong to Penn State and Purdue at 57 and 65 yards respectively. Teams carried it an average of 42 times and did so at a clip of 4.8 YPC as well for about 2 rushing TDs.
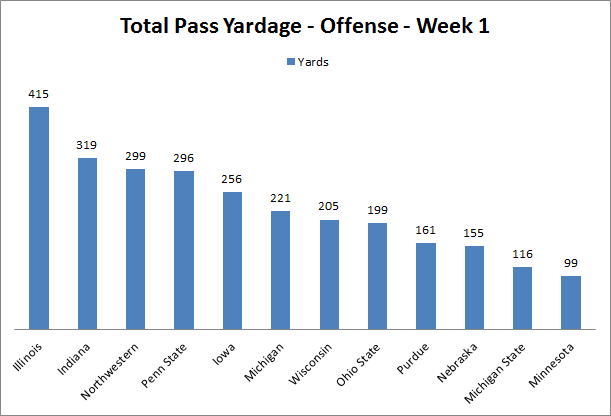
Through the air, the 228 yards came about as the result of a typical performance being 17-28 with 13.4 yards per completion and 8.1 yards per attempt being the conference average. Further, the Big Ten averaged 2 interceptions and 2 passing TDs in its games. The average completion percentage of a Big Ten team this past weekend was 61.43%. Illinois gained the most yards in the air – 415 on a conference-best 29 completions (37 attempts). The least successful passing attack belonged to Minnesota – 10-23 for 99 yards.
Big Ten teams scored an average of 39.5 points, including a typical performance of 2 FGs and 5 TDs. Indiana scored the most points far and away with 73 of them on Thursday, and then at the other end of the spectrum, there was Purdue and their 7 against Cincinnati.
There was a wide variation when it came to the number of first downs earned as well. Against the conference average of 21, Indiana managed 29 first downs against Indiana State, and at the other end, Purdue managed 12 first downs in their game. On third down, the average performance was 7-15 – Michigan converted the most with 10, but Wisconsin had the highest percentage at 72.7% (8-11).
THE CONFERENCE ON DEFENSE:
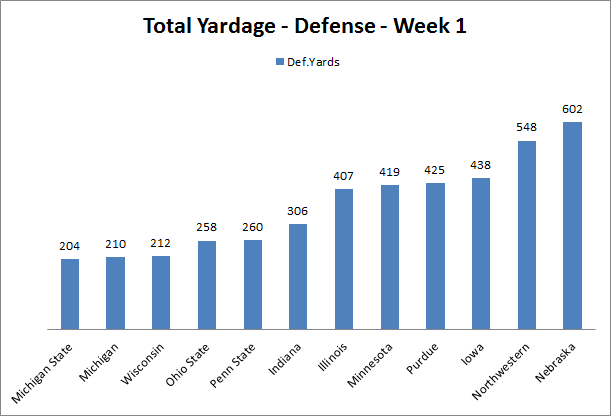
On the other side of the ball, the Big Ten gave up an average of 357 yards, broken down into about 240 yards passing and 117 yards rushing in a typical game. They defended an average of 73 plays, yielding 4.8 yards per play.
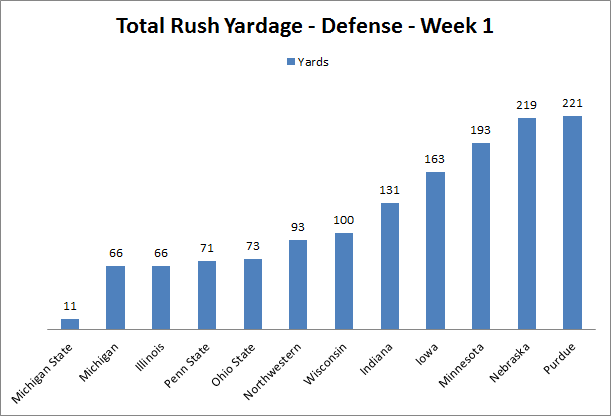
Although this could be blamed on a host of things, Michigan State yielded only 11 yards rushing to Western Michigan on 27 attempts, or an average of 0.4 YPC, far and away the best performance statistically over the weekend. Purdue owns the worst performance in rush defense, yielding 221 yards to Cincinnati across 47 attempts, or 4.7 YPC. It is important to note, however, that UNLV was getting nearly 6 yards per carry against Minnesota. The conference average was 3.4 YPC on defense in the first week.
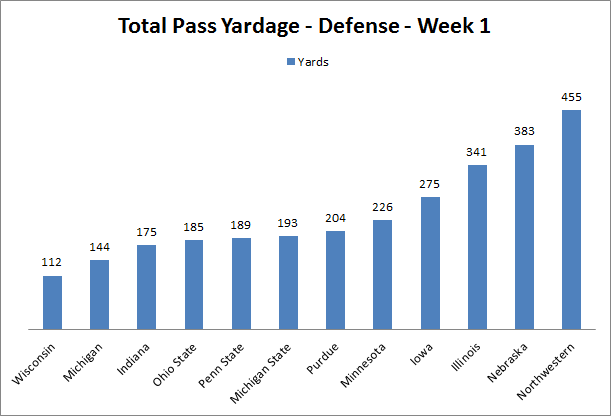
Wisconsin owns the best overall performance in pass defense this weekend, giving up only 112 yards in the air, followed by Michigan at 144 yards. By a considerable margin, Northwestern’s 455 yards given up in the air to Cal rates as the worst performance on pass defense, although Purdue, Illinois and Nebraska were giving up longer passes on average.
The conference allowed an average of 18 first downs to teams, with the most being the 35 that Nebraska handed to Wyoming, and the fewest being 11, or the number allowed by Penn State against Syracuse. Third downs were difficult to convert if you played the Big Ten in general – the average success rate was 5-16, but Northwestern allowed Cal to convert 10 times, and Nebraska allowed Wyoming to convert just once. That being said, Wyoming didn’t need to get to third down very much.
THE CONFERENCE WHEN KICKING / PUNTING:
Big Ten teams average 4 punts for 177 yards over the weekend, or a shade over 40 yards per punt. Michigan State did an awful lot of punting – 11 of them for 423 yards, whereas Michigan and Wisconsin only have one each. Interestingly, Michigan State turned it around to have one of the best punt return performances, returning 5 of them for 52 yards, but Indiana returned 4 punts for 90 yards.
When it comes to kickoff coverage, Indiana and Michigan got quite a bit of practice in, being in this situation 12 and 10 times respectively. Indiana managed 777 yards of it for an average of 64.8 yards per kick with 6 touchbacks. That’s against the typical performance of 8 for 479 yards and 3 touchbacks. As for kick returns, Minnesota and Illinois both took one to the house and racked up 148 and 135 yards of return yardage respectively. Despite scoring the most points, Indiana owns Week 1’s least impressive performance on returns – 3 for 31 yards.
CONCLUSION:
As the programmers at Infocom would say, "The point of the game is to discover the point of the game."
OBLIGATORY:

September 3rd, 2013 at 10:49 AM ^
Sorry to be that guy, but didn't Penn State play Syracuse?
Other then that this was really interesting and informative, thanks for the quick and enjoyable read!
September 3rd, 2013 at 10:53 AM ^
You are quite correct. Fixed.
Thanks for the catch!
September 3rd, 2013 at 2:04 PM ^
This is fun - can never have too many stats, but this would be a lot easier to digest with a few well conceived bar/column charts. In particular so we can quickly see where Michigan fits in the B1G averages.
September 3rd, 2013 at 2:40 PM ^
That I did make were actually pretty basic, and I debated posting them, but as DrThrall rightly points out, it might be nice to show people where Michigan fits in on some of the measures. Below is what I did make this morning, but if anyone wants to see more, I can definitely make them as time permits:
September 4th, 2013 at 9:48 AM ^
I like 'em. Keep it coming, if able. You say they are basic charts but it cuts right to the chase which isn't always a bad thing.

Comments