Some Of The Ups And Downs Of The Offense In 2013
As the first in a series of works which will summarize the season, I have decided to first focus on the thing which probably troubled people the most on this board (and how troubling will become apparent in the summary of MGoCursing); the offense.
SUMMARY DATA:
Before we get into a few more analytical graphs, here is the overall summary:
|
TOTAL PASSING |
3025 |
|
TOTAL RUSHING |
1569 |
|
TOTAL YARDS |
4594 |
|
|
|
|
AVG. PASSING |
252.08 |
|
AVG. RUSHING |
130.75 |
|
AVG. YARDS |
382.83 |
|
|
|
|
AVG. COMP. % |
59.92% |
|
AVG. YDS PER COMP. |
14.04 |
|
AVG. YDS PER ATT. |
8.68 |
|
AVG. YDS PER CARRY |
3.06 |
|
AVG. NO. PLAYS |
70 |
|
AVG. YDS PER PLAY |
5.37 |
If you’re wondering where that leaves us in the whole of FBS teams, it is something of a mixed bag of results. If you look at the second set of numbers in the table (average passing, rushing and yards), our passing offense was 43rdin Division I, for example, and our rushing offense was 99thin Division I. Our total offense was 82nd. Our red zone offense, which you won’t see discussed in this particular work, was 51stin Division I. These rankings come from the NCAA and actually differ some with TeamRankings, but you should have an idea of where were sit approximately as an offense for the year.
YARDS PER PLAY AND ITS COMPONENTS:
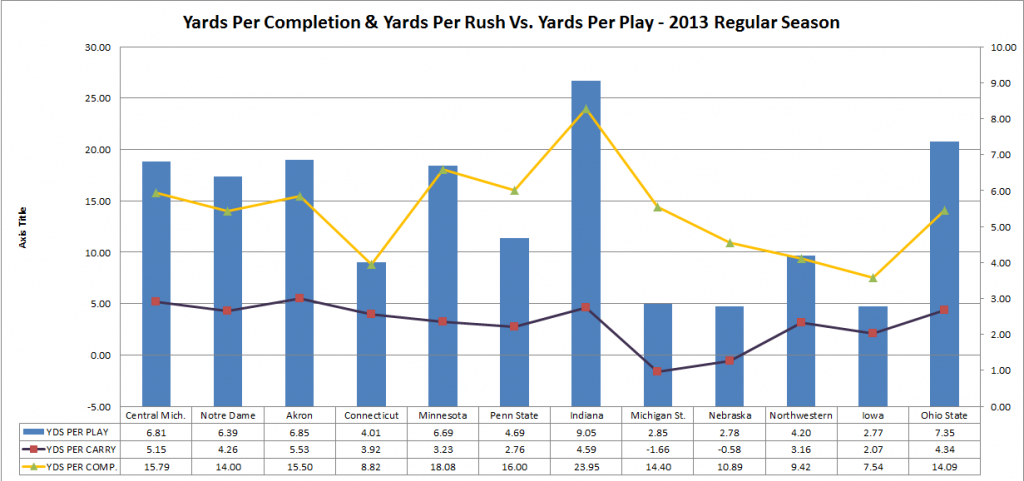
Something else that has been mentioned extensively on this site is that our average offensive yards per play was not exactly impressive for most of the year. Indeed, for the Michigan State, Nebraska and Iowa games, we did not even average three yards per play. What you will see below is that our best overall performance on a yards per play basis are Indiana and Ohio State, with Akron, Central Michigan and Minnesota in the next group. On a yards per completion basis, Indiana, Minnesota and Central Michigan are the top three. On the ground, the same games in which we were having a lot of success in the air were the same ones in which we had a lot of success on the ground, so Indiana, Minnesota and Central Michigan, but Akron is on that list as well for relatively successful rushing efforts.
RUNNING, PASSING AND WHEN TO DO THESE THINGS:
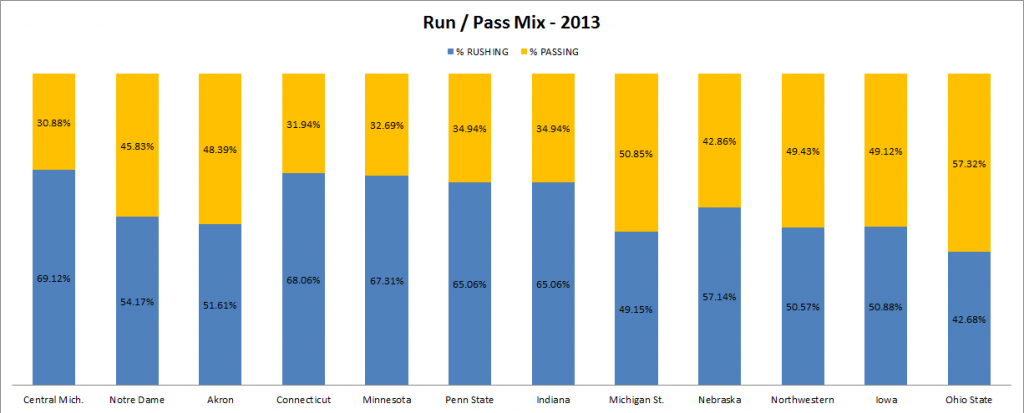
In the event that you may be interested in just how much we ran the ball versus passing it, there is an answer for this question – we ran the ball 57.50% of the time and passed the ball 42.50% of the time overall. Now, the individual frequency across games was actually quite varied, as you may have assumed. Indeed, there was a stretch in the middle of the season – mainly due to turnover problems – were we did not pass more than 35% of the time. Some of our more balanced games include some epically bad rushing performances too, so finding the right mix was not an easy task this season, as the graph below shows.
EFFICIENT USE OF A LOT OF PLAYS:
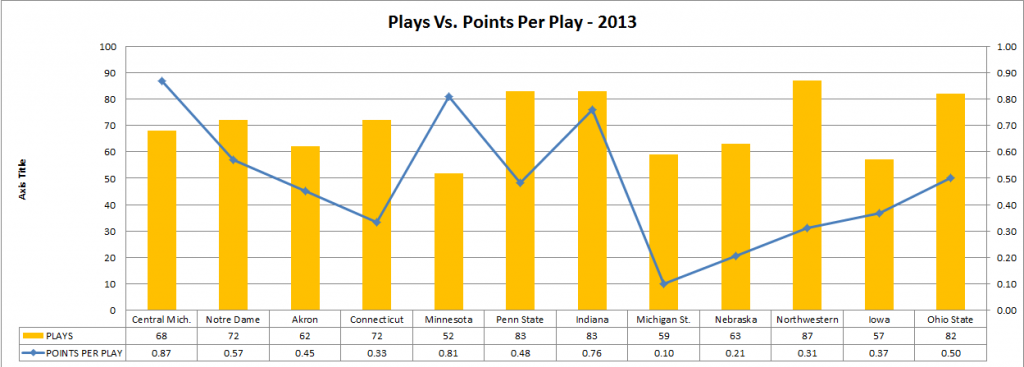
Points per play is an interesting metric and seems like it is a very good indicator of overall efficiency when it comes to our time on the field versus our trips to the end zone. You’ll see how relatively unpredictable we were below, as well as how inefficient we were sometimes. Clearly, on a points per play basis, our worst performance was Michigan State – 59 offensive plays and six points makes for 0.10 points per play. Indeed, in first part of November, we were having…difficulty if this is any indication.
LONGER PASSES, BETTER RESULTS PERHAPS:
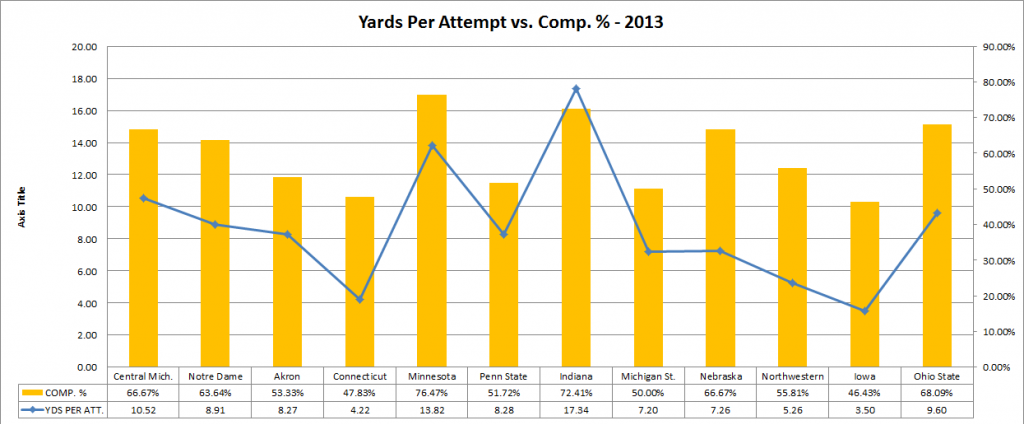
I combined yards per attempt versus completion percentage and found something I had not thought about before quite honestly. The longer our attempts, the more of them we were completing typically. That should make sense however, because as you can see in the chart below, Connecticut, Penn State and Iowa were some of the least prolific passing games and also games with some of the less memorable passing results (also rushing, in the case of Penn State).
WHERE THE SUCCESSES CAME FROM:
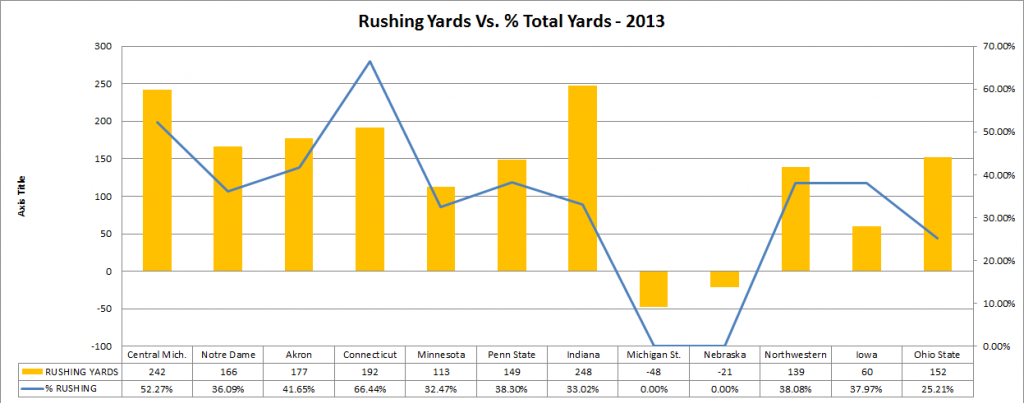
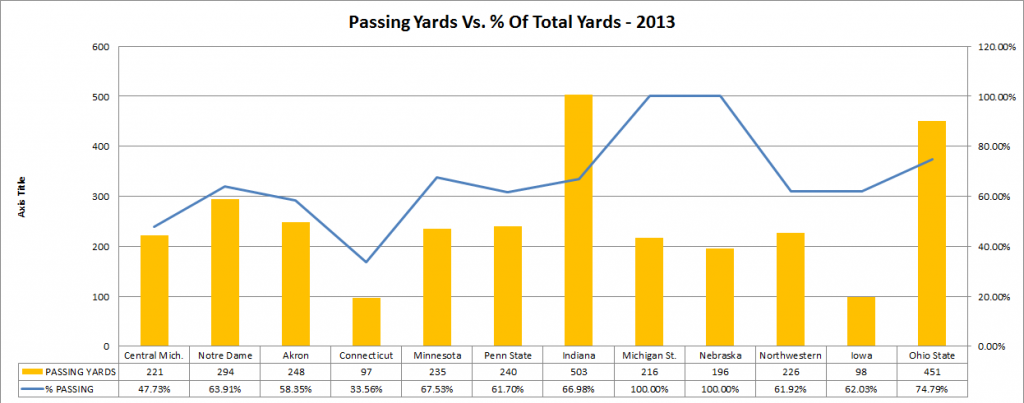
The next two graphs show total passing and rushing versus the percent of total yards that they represent in that game. These are interesting because they underscore just how troublesome the rushing offense was virtually all year when it comes to being a major force in the offense as a whole. Actually, for Michigan State and Nebraska, I simply input the numbers rather than say that passing was 128% of our offense at Michigan State, for example. It was not a joy to calculate this one out.
TL;DR CONCLUSION:
If you didn’t read this and instead skipped down to here, you’ll not be surprised when I say that everything above is not new information per se, but it is merely an illustration of what the struggle looked like on paper.
December 3rd, 2013 at 10:53 AM ^
2013 Michigan, 4th highest standard deviation of an offense since 2003 @mgoblog @AceAnbender
— Brett Thiessen (@The_Mathlete) December 3, 2013
December 3rd, 2013 at 11:11 AM ^
I wonder if he was talking about total yards, because the average was 382.83 yards with a standard deviation of 170.40 yards, which basically means were were all over the place. If you normalize the rushing and passing totals, the z-score for rushing for MSU is -2.057 and for Nebraska it is -1.747. For passing, the two lowest were Connecitcut (-1.348) and Iowa (-1.339).

Comments