Regular Season In Review: Some Summary-Type Stuff
REGULAR SEASON IN REVIEW: SUMMARY-TYPE STUFF
Well, all the data for the regular season is now and we are hopefully setting up for a nice postseason run in Ann Arbor, both in the conference tournament as well as in the NCAA Tournament. With any luck, we’ll still be sitting here in a couple weeks with the season still going for us, but then we won’t really know how that journey will begin until this coming Sunday. All the same, I did want to share at least some of the summary data from the season with the board, or at least the stats that I had been tracking anyway.
First, here is the overall summary:
|
WHOLE SEASON |
MICHIGAN |
OPPONENT |
|
Field Goal % |
48.20% |
44.28% |
|
Three Point % |
39.56% |
33.23% |
|
Effective FG% |
55.97% |
49.56% |
|
Free Throw % |
75.44% |
72.69% |
|
Off. Rebound % |
28.86% |
28.02% |
|
Def. Rebound % |
71.98% |
71.14% |
|
Assist / Turnover Ratio |
1.77 |
1.29 |
|
True Shooting % |
60.36% |
53.12% |
|
Free Throw Rate |
36.46% |
28.20% |
|
Possessions |
62.46 |
62.77 |
|
Points / Possession |
1.21 |
1.04 |
|
Turnover % |
12.98% |
15.29% |
|
Points |
75.53 |
65.20 |
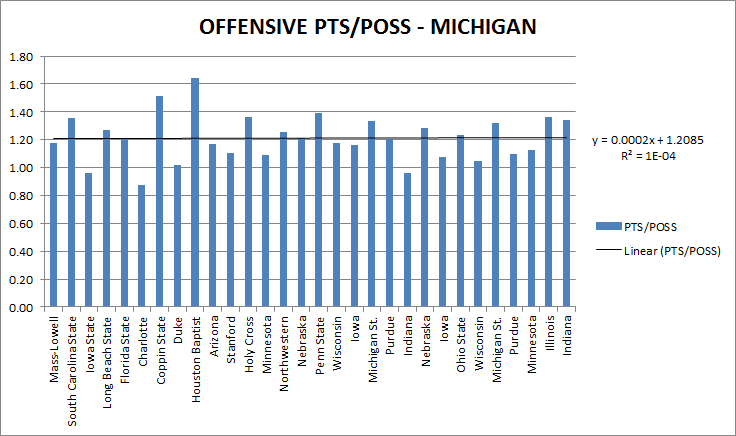
Many stats in basketball are up and down with particular games, so it is sometimes difficult to establish many reliable trends. In the case of Michigan, a couple of these stats are interesting in that they were – for basketball – relatively stable. For example, points per possession throughout the season looked like this:
The standard deviation for this particular statistic for Michigan is 0.12, which is fairly narrow, I would say. What it seems to say is that, overall, we were both effective and efficient and able to control the game throughout. That seems consistent with the fact that the standard deviation of total possessions was only 3.6 possessions. Michigan made the rules, if you will, on most nights.
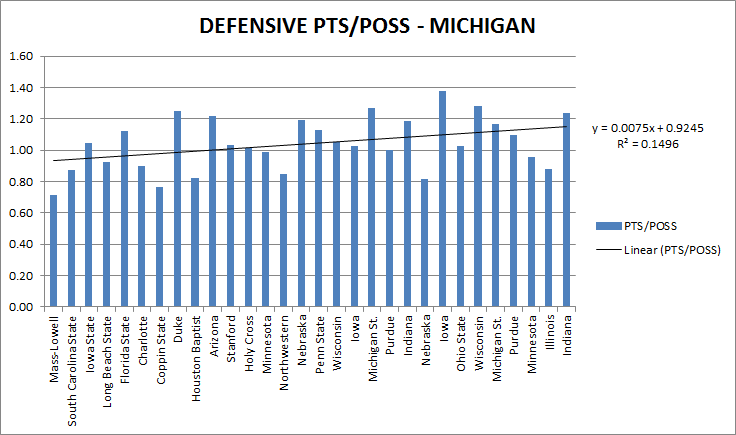
Defensively, as summarized in “This Week’s Obsession”, it is what it is. Here is the rough trend for opponent points per possession:
So, there was a slight decline as the season pressed forward, and that would be consistent with how the majority of the more strenuous complaints about defense – particularly transition defense and easy looks – came in the last half of the conference schedule.
Here is the out-of-conference summary:
|
OUT OF CONFERENCE |
MICHIGAN |
OPPONENT |
|
Field Goal % |
47.09% |
41.97% |
|
Three Point % |
37.92% |
35.20% |
|
Effective FG% |
54.90% |
46.96% |
|
Free Throw % |
73.33% |
71.86% |
|
Off. Rebound % |
31.62% |
25.64% |
|
Def. Rebound % |
74.36% |
68.38% |
|
Assist / Turnover Ratio |
1.90 |
1.06 |
|
True Shooting % |
58.96% |
50.50% |
|
Free Throw Rate |
35.84% |
25.93% |
|
Possessions |
65.03 |
65.12 |
|
Points / Possession |
1.22 |
0.97 |
|
Turnover % |
11.99% |
16.18% |
|
Points |
79.08 |
63.50 |
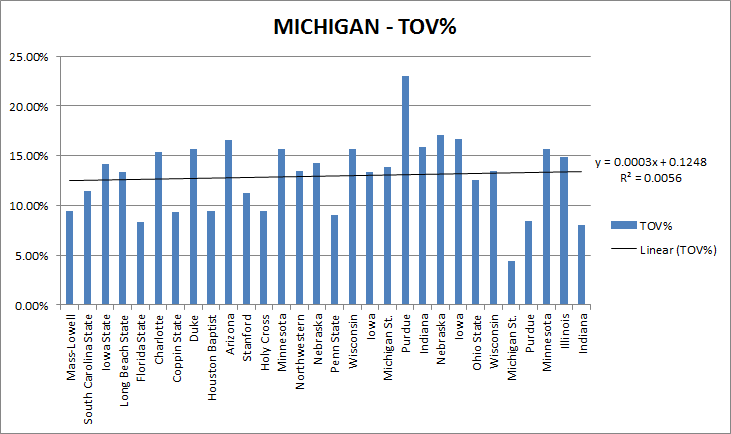
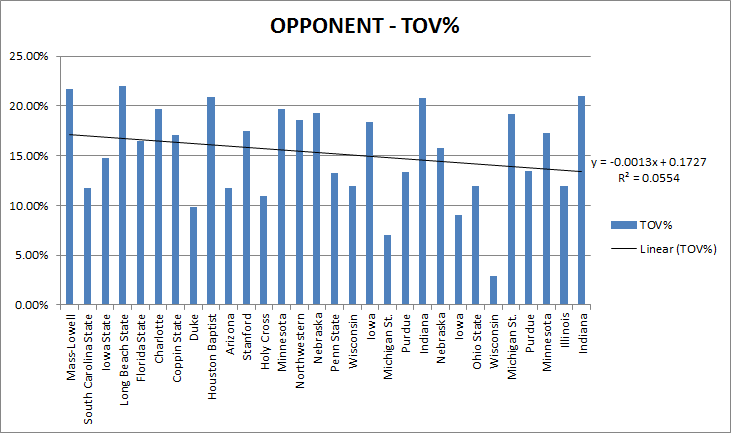
With noted exceptions, we did quite well overall in the first 12 games. Most of the statistics above swing decisively for Michigan, but the overall strength of the schedule should always be taken into account. One thing I was curious about here – mainly because I didn’t think about it before – was the advantage in turnover percentage, which we lost when we hit the conference schedule. That’s because we ran into far more disciplined teams, of course, but the whole season trends looked like this:
Michigan –
Opponent –
Again, very rough trends, but my suspicion was correct - our TOV% actually became marginally worse whereas opponent TOV% was decreasing (roughly) as things progressed. Indeed, when you see the conference table, the nearly 5% advantage you see above narrows to less than 1%.
The conference table:
|
IN CONFERENCE |
MICHIGAN |
OPPONENT |
|
Field Goal % |
48.94% |
45.82% |
|
Three Point % |
40.65% |
31.92% |
|
Effective FG% |
56.69% |
51.29% |
|
Free Throw % |
76.85% |
73.24% |
|
Off. Rebound % |
27.02% |
29.61% |
|
Def. Rebound % |
70.39% |
72.98% |
|
Assist / Turnover Ratio |
1.68 |
1.45 |
|
True Shooting % |
61.30% |
54.87% |
|
Free Throw Rate |
36.87% |
29.71% |
|
Possessions |
60.74 |
61.21 |
|
Points / Possession |
1.20 |
1.08 |
|
Turnover % |
13.64% |
14.71% |
|
Points |
72.53 |
65.53 |
As many of the previous diaries seemed to point out, great shooting was going a long way for us. Indeed, average effective field goal percentage for Michigan is still about 5% higher in the conference schedule. We lost the advantage in rebounding, but we were still getting sent to the line more (free throw rate) and making a few more of those free throws typically. I know some people mumbled a bit about how a fair number of the games in the conference were close, and indeed, the average scoring margin – win or lose – was +6.8 points. The adages are true then – “gotta make that shot” and “gotta make your free throws”. We did more often than not.


