QB Metamorphosis
In football the QB position is the lynchpin for the whole offense. They touch the ball on every play, read the defense, and choose the best course of action based on what they see in the moment. So, naturally, the outlook of an offense depends in large part on the outlook of the QB who will be flying the plane. The goal of this diary is to see if there are any reliable trends in how a generic QB progresses from one year to the next and to investigate if there are factors that can be identified and quantified that will aid or hinder his on field success. I'm actually very surprised about how clear the data is.
To do this I have accumulated information for 226 quarterbacks that have played in BCS conferences since 2003. The pool was restricted to BCS schools so that some level of control was applied to the level of talent surrounding and opposing the quarterback; the presumption being that players in BCS conferences will be playing with and against talent that is on par with their own.
If a player did not average at least 10 passing attempts per game he played in a given year, the data point was not considered because the number is highly unreliable (small sample size). This shuts out some interesting pieces of data (Tim Tebow 2006) but improves the overall conclusions significantly. In Tebow’s case, his second year as a regular player was his first year as a regular passer so his sophomore season was placed in the Year 1 group. There are a few other, more obscure anomalies that were given the same treatment. The large number of data points make the impact of those anomalies negligible.
The metric I used for this study is NCAA Passer Rating. Unfortunately, Passer Rating isn’t perfect when it comes to evaluating QBs; there are many disses available on that topic (Advanced NFL Stats, Football Outsiders, Fifth Down). I leave the detailed explanation to the articles I’ve linked. However, though it’s imperfect, passer rating is still a familiar number for most football fans and it does provide significant and reasonable insight into the relative performance of QBs. On with the show.
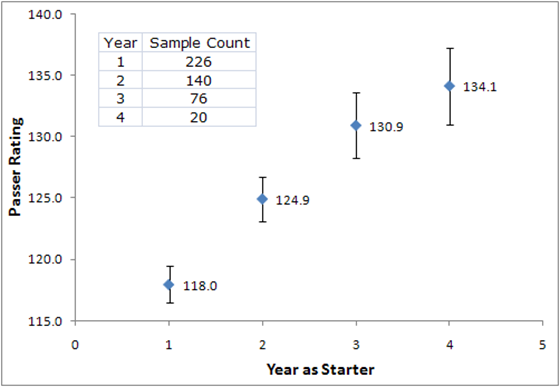
The following chart shows the average NCAA QB Rating by year of experience for all QBs included in this study.The chart includes the standard error of the averages for those that know what that means (or are good guessers). The chart shows a couple of interesting things: more experience is better, which…duh, and the average QB rating seems to improve by approximately equal amounts going into year 2 and into year 3 but then tails off a little going into year 4.
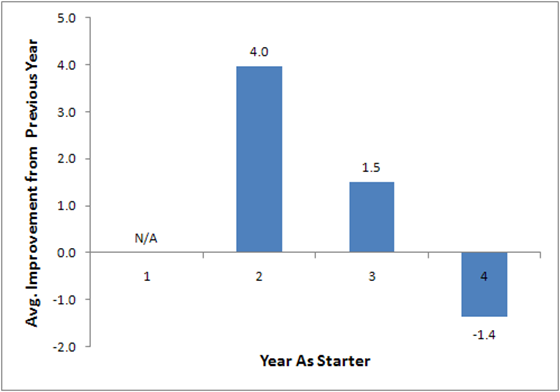
Now, the second point goes against conventional wisdom somewhat; QBs are supposed to improve a lot more after their first year than after subsequent years. The fly in the ointment is that, in order to track improvement, the data should be evaluated as matched pairs. This means that we should take each specific QB’s improvement over the preceding year and then average the deltas to understand the average improvement from one year to the next. Doing that yields this chart.
This chart shows what we expect to see, the change after the year 1 is much bigger than the change after years 2 and 3. But, now there’s the apparent negative improvement between years 3 and 4. What’s up with that?
Need … more … charts …
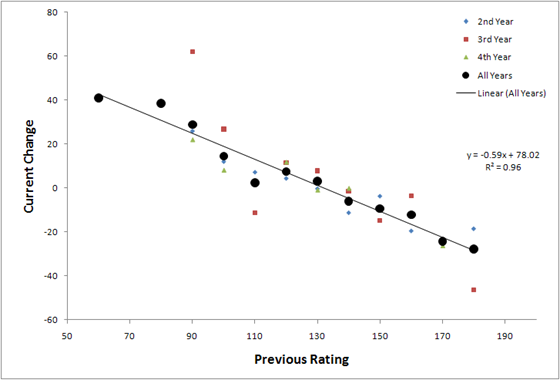
What I did here is plot average improvement versus the previous year’s rating. To clear out the inherent noise in the data, I lumped QB Ratings near each other together (i.e: ratings from 115.0 to 124.9 treated as 120 and so on). The trends are clear and strong, and they demonstrate that mean reversion is in full effect—the higher a QB’s rating is in a given year, the more likely he is to have a lower score in the next year and vice versa. It’s very difficult to have 2 really good or really bad years in a row (unless the QB is awesome or terrible).
We know from the first chart in the series that ratings go up as your years of experience goes up, hence, by the fourth year as starter, the net expected change is negative. The guys above 130 are likely to fall back and the guys below 130 are likely to move up. This effect allows us to infer that there is an expected upper bound for a seasoned QB, probably in the 130 to 140 range. One possible explanation for this phenomenon, is that a QB is unlikely to have the same group of players around him for all four years. The team around him might be out of phase with his development and that will have an effect on the numbers he puts up.
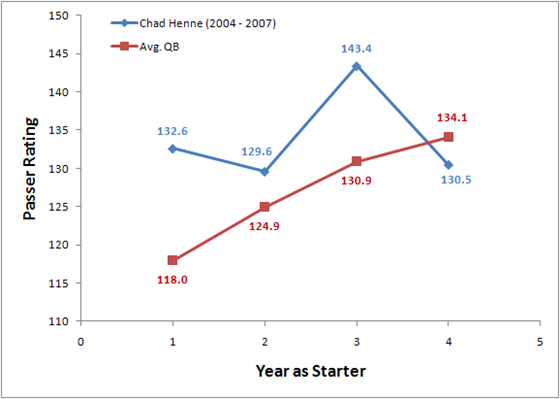
The familiar example around here is Chad Henne. Chad had Braylon Edwards and a veteran offensive line in his first year. So any improvement he may have developed in between 2004 and 2005 was partially offset by the loss of Edwards and other changes around him. However, as the team around him developed and he continued to develop, he saw a big jump in performance in his third year. Then, going into 2007, there were many losses on the offensive line in addition to Steve Breaston, and Henne’s numbers fell back to the 130-ish level. Overall it looks like Henne never really improved, but the reality is that his development made up for and was masked by the changes in the team around him in all likelihood. I think this is a more plausible explanation than “he was always sweet and he never got better.”
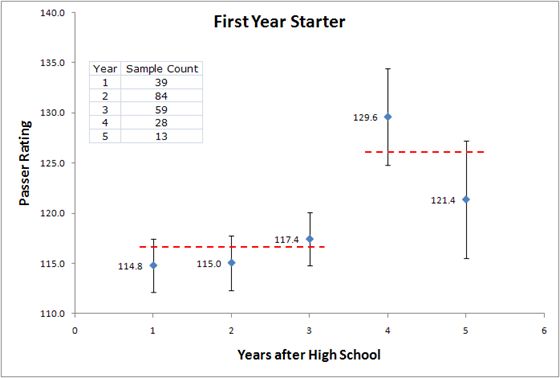
Finally, it’s worth taking a look at the dependency of first year performance vs. Seniority. The question being: is it better to have a redshirt junior making his first start instead of a true freshman?
Once again I’ve plotted the averages and their corresponding standard error and included sample size along the axis for reference. The responsible conclusion is that seniority is not a significant factor in first year success for Redshirt Sophomores or younger. Players older than that seem to perform better. However, you could just as easily conclude that since the averages overlap so much, especially in non-adjacent points, the trend is pretty weak and that no trend exists. It seems that other factors, such as supporting cast and the overall talent of the player, matter more than the age of the QB when he makes his first collegiate start. The team thing is difficult to assess but talent is easy; Rivals.com, be my guide.
Same thing as before, lumped averages with standard error and sample sizes shown. This time, I think the trend is real because: A) it makes sense and B) there is no overlap between 2-stars and 5-stars. Also, a 5-star QB is more likely to have a good team around him than a 2-star player is. All of these things support the trend despite the uncertainty in the data. There’s another reason, let’s zoom in on 5-stars; this time with a table.
| Player | School | Season | Rating | Notes |
| Reggie McNeal | Texas A&M | 2003 | 124.5 | |
| Trent Edwards | Stanford | 2003 | 79.5 | 4 new OL; 2 new WR; new RB |
| Vince Young | Texas | 2003 | 130.6 | |
| Chad Henne | Michigan | 2004 | 132.6 | |
| Kyle Wright | Miami (FL) | 2005 | 137.2 | |
| Marcus Vick | Virginia Tech | 2005 | 143.3 | |
| Rhett Bomar | Oklahoma | 2005 | 113.5 | |
| Anthony Morelli | Penn State | 2006 | 111.9 | 4 new OL |
| Matthew Stafford | Georgia | 2006 | 109 | 3 new OL; 2 new WR; |
| Mitch Mustain | Arkansas | 2006 | 120.5 | |
| Xavier Lee | Florida State | 2006 | 123.5 | |
| Jimmy Clausen | Notre Dame | 2007 | 103.9 | 3 new OL; 1 new WR |
| Mark Sanchez | USC | 2007 | 123.2 | |
| Ryan Mallett | Michigan | 2007 | 105.7 | ??? |
| Tim Tebow | Florida | 2007 | 172.5 | |
| Tyrod Taylor | Virginia Tech | 2007 | 119.7 | |
| Terrelle Pryor | Ohio State | 2008 | 146.5 | |
| Blaine Gabbert | Missouri | 2009 | 140.5 | |
| Matt Barkley | USC | 2009 | 131.3 |
When you strip out the four guys that had extenuating circumstances (Mallett stays in), the average is about 131. That’s approaching the theoretical upper limit right away, on average.
I’m currently working an a project that tries to use this information to see what we can expect out of the QBs on our upcoming schedule. I’ll also try to use the dataset to try and tease out what we can expect out of our guys based on QBs similar to themselves.
star rating does matter? but what about pat white? he was a 3*...
/s
this should be standard reading for the 'star rankings don't matter' people.
I am confused by the illogical belief that "star rating" matters, by UofM students and alumni, no less. While it is true that those who give out the ratings can recognize the difference between an excellent prospect and a prospect who isn't and thus create a positive correlation between their rankings and future success, a specific player's star rating does not matter.
If a rating service had decided to give Obi Ezeh 5 stars, Obi Ezeh would still be Obi Ezeh. If a rating service had given Tom Brady 2 stars, Tom Brady would still be Tom Brady. Handing out a rating does NOT change a player's ability. It is a reflection of it.
Higher ranked players outperform lower ranked players because those ranking them can tell the difference between the best prospects and those who aren't, within limits. But, those ranking them are also often wrong.
There are many variables that go into a college player's success. One player may be a full grown man at 16. Another may physically mature at 21. One may be ultra-competitive, another casual. One may be disciplined, another lazy. One may be smater than another. One may stay eligible, another may not. One may be in a system that makes best use of that player's talent, another may be a square peg. The list goes on and on.
If ALL you have to go on is a player's star rating, then choose the 5 star over the 4 star, the 4 star over the 3 star, etc.
But, if you are a good coach, you'll have much more to go on than the rankings of a bunch of guys who watch film all day.
You start off criticizing the belief that stars matter:
<blockquote>I am confused by the illogical belief that "star rating" matters</blockquote>
and follow that up with
<blockquote>While it is true that those who give out the ratings can recognize the difference between an excellent prospect and a prospect who isn't and thus create a positive correlation between their rankings and future success, a specific player's star rating does not matter.</blockquote>
How can this be true? Is it illogical that star ratings matter or is there a positive correlation between rankings and future success?
edit: blockquote help anyone?
...<blockquote> when in the plain text editor. Use the "quotation" button when in the rich text editor.
Testing
thankyou
Makes sense to me. However, I wonder if this is partially a function of the fact that four- and five-star QBs tend to commit to schools already loaded with talent, which means they are surrounded by better players than your avg. 3-star has at a slightly lesser school. I guess to test that you'd have to look at the performance of 4- and 5-stars at "lesser schools," but the sample size might be so small as to be statistically unusable.
Suggestion: normalize each QB's passer rating by the average Rivals star ranking of the team that QB plays for, and then run the comparison between skill-normalized QB rating and QB experience. I suspect the trend would become even more clear (as the Henne anecdote suggests). Of course, to really normalize properly, it'd be even better to use the average star rating for the offensive two-deep, and maybe even factor in years of starting experience for the rest of the offense... that's probably an awful lot of work for 61 BCS teams over 7 years.
In any case, very nice analysis, and excellent use of charts.
See above, please.
Kafka.
about leaving people with fewer then pass attempts/game in the first year off is Pat White. He played in 12 games in 2005 and only attempted 114 passes so I'm assuming he was left off your list. The reality is though he played a ton in 2005 and was one of the main catalysts in getting WVU to the Sugar Bowl. So he had a lot of experience heading into his sophomore year, which with your criteria would have been his first year. I'm guessing not to many people fit that catagory though.
So theoretically, Tate with a rating of 128 is in the upper 5 star first year range. How did the second 5 start QB's improve, or did they trend towards the 130 norm?
Denard probably didn't have a big enough sample, and stands to show a significant second year jump - unless we really consider this his first year.
You need to remove WMU, EMU, and DSU from the numbers. When you do that he is upper 4 star, lower 5 star.
Actually, I wouldn't remove WMU, and possibly EMU. DSU I'll grant though Tate didn't play long in that game. And in fact I'd say Forcier's injuries probably did more to bring down his rating (much the same as Henne in 2007), than WMU and EMU's defenses brought them up.
Eitherway, if he is in lower 5 star range (as a compromise), that means theoretically Tate has room to improve significantly from year 1 to year 2.
So does Denard.
I am sooo bored waiting to see it!
Well, the reason you remove them is because all of the data above is only against BCS competition. He only threw two passes in the game, so it's not like it makes much of a difference anyway.
The data shown is for players in BCS conferences. Stats accumulated against the App. States, Northern Illinoises, and Central Michigans of the world are in. The logic for not stripping them out is that teams in BCS conferences play comparable schedules. Tate Forcier's 2 attempts against DSU are as valid as Chad Henne's 37 attempts against App. St.
Also, as you said, the number of attempts that the guys who meet the 10 att/gm threshold have against FCS competition is usually pretty low because they don't play the whole game (like Tate Forcier). Over the course of 250 pass attempts, my guess is that stripping out the stats against FCS competition will have very little effect on the overall passer rating for a QB in a given season.
In the study, Tate's first year Passer Rating was 128.
Sorry, I misread the OP. I'd still be interested in a similar study of QBs in spread run systems with a lower threshold of passes/game.
I think with the experience they gained last year and all the players returning on offense these charts show we should expect significant improvement this year.
http://sports.espn.go.com/ncf/player/profile?playerId=480264
http://sports.espn.go.com/ncf/player/stats?playerId=480237
Those are links to Tate's and Denard's stats from last year. Take out EMU, WMU, and DSU and Tate drops to 123.6. That's around a year 2 starter. If we can expect the large improvement from year 1 to year 2, he might be closer to the year 4 QBs. However, since he was so well coached coming in, he probably is closer to the year 2-3 jump.
What this doesn't take into consideration is any running ability. It was brought up that Pat White did not reach 10 passes/game his first season, but if you expect that he ran the ball an average of 5 times (The coaches have said that 6-7 is where they want their QBs to be) then (1) he is touching the ball an average of 14-15 times per game and (2) he is accumulating a lot of rushing yards in the process.
Taking that into consideration and applying it to our two QBs, I think we can expect Denard to look like a Year 1 QB in terms of passer rating. If Tate looks like a Year 3 QB, Denard averages 3 more yards per carry (Tate at 2 YPC and Denard at 5 YPC), and Denard runs on average twice as often as Tate, then who is our starter?
I would have to say it is probably still Tate's to lose. Tate would have to show little to no improvement or Denard would have to prove to be at least a Year 2 level Passer. Given a Year 1 or a Year 3 Passer, I think it will be crucial to have the experienced passer in end game situations. FWIW, NCAA 2010 says Tate this year and Denard next year.
Do you think you could do something similar for QBs in spread run systems? Maybe even include running statistics somehow? It might not be as accurate because of smaller sample sizes, but it would be a lot easier to compare to our situation.
Like I said - if we take out all the games where Tate was playing with a bum shoulder, then what is his rating ...
That's basically everything after Indiana. So you want his passer rating against ND and Indiana?
My point is, if you take out WMU and EMU -- WMU at least being a measure of when he was healthy against a team we were expected to be challenged by -- then you should take out all the games after he was injured. Those games are not representative os his healthy potential.
So leaving the WMU and EMU games in at least balances the picture more between Tate before injury, and Tate injured.
My view either remove them all down to ND and IU, or keep them all. You can pull out Delaware State if you like. Doubt if it changes the numbers much as he didn't play a lot of snaps in that game.
If the 5 star first year ratings include non-BCS opponents, so should Tate's.
Then again, even if Tate was with the upper 4 stars and lower 5 stars - thats well above the average first year QB. Soooo, I like to think that Notre Dame Tate is the real Tate. The kid is good!
Error bars and Range are not the same thing. What the error bars represent is the range where the true average lies given the data presented. That's why averages with larger overlap are dubious--they're probably not different and, if they are, its not by a whole lot.
The actual range of 5 star first year performance is shown in the table, 79 - 172. Basically all players fall in that range.
My personal opinion is that Forcier performed like an average 5-star player in his first year. That is the conclusion that is supported by this study.
"I think with the experience they gained last year and all the players returning on offense these charts show we should expect significant improvement this year."
I can't see anything that's not totally reasonable in this comment by MGoVictor. If somebody negs it, then at least have the bones to explain what the flaw in the reasoning is. If somebody's negging just to be a dick, then they're succeeding admirably.
Maybe if Mqovictors learned how to spell Rodriguez correctly, people would stop negging him.
WTF? The word "Rodriguez" is not in his comment. If you're the one negging him for a non-existent mistake, you're the dick.
Maybe you just aren't very familiar with MGoVictors23's track record around here. If you look through his comments, he consistently spells Rodriguez with a Q and is constantly corrected. The man's g and q buttons both work, he's been told 100 times the proper way to spell Rodriguez, yet he chooses to spell it with a Q. I deem that neg-on-sight worthy. Apparently I'm not the only one.
I don't like the trend of ignoring games against teams percieved as having lesser talent. It's almost as though one is asking Michigan to apologize for being successful. Games against all schools count, and should be taken into consideration when compiling stats. MSU's multiple losses to CMU over the years serve as an example that all schools are to be taken seriously, both on the field and in the record book.
I won't join the chorus of those who want to tell anyone else how to think, but my thoughts are that I am very happy whenever Michigan wins a game. If they happen to be playing a directional instate school, I love seeing them hang 50 on the board. I might not live there anymore, but I remember plenty a fine, sunny day at the Big House, watching third-stringers play the fourth quarter and having experiences that they probably will relive for the rest of their lives.
is there any quick way to convert passer rating into points above average?


Comments