A Purely Demographic Look at the B1G versus the SEC, and Thoughts About Expansion

As your resident demographics nerd, I want to delve a little into something we hear a lot about with conference expansion, and that is, like, people living places and stuff. This is a pretty unrefined look, as I am not looking into actual football fans or recruits coming from certain states (this has been done before, and better, by others, so I won't reinvent the wheel), just pure eyeballs that exist in said state, and population trends. First, let's look at current and future B1G states. For unfortunate reasons, as I was making the chart, it kind of de-pretty-fied, so in an effort to not remake it, I will explain that the way to read this is like so:
| 1990 Pop. | % Growth |
| 2000 Pop. | % Growth |
| 2010 Pop. | % Growth |
| 2012 Est. Pop. | % Growth |
So, Wisconsin had 4,891,769 people in 1990, grew 4% even from 1980, and was estimated to have 5,726,398 in 2012, as we can see in the chart below. Dig? So, here is some raw data (all from Wikipedia):
| Wisconsin | |
| 4,891,769 | 4.00% |
| 5,363,675 | 9.60% |
| 5,686,986 | 6.00% |
| 5,726,398 | 0.70% |
| Indiana | |
| 5,544,159 | 1.00% |
| 6,080,485 | 9.70% |
| 6,483,802 | 6.60% |
| 6,537,334 | 0.80% |
| Iowa | |
| 2,776,755 | −4.7% |
| 2,926,324 | 5.40% |
| 3,046,355 | 4.10% |
| 3,074,186 | 0.90% |
| Maryland | |
| 4,781,468 | 13.40% |
| 5,296,486 | 10.80% |
| 5,773,552 | 9.00% |
| 5,884,563 | 1.90% |
| Michigan | |
| 9,295,297 | 0.40% |
| 9,938,444 | 6.90% |
| 9,883,640 | −0.6% |
| 9,883,360 | 0% |
| Minnesota | |
| 4,375,099 | 7.30% |
| 4,919,479 | 12.40% |
| 5,303,925 | 7.80% |
| 5,379,139 | 1.40% |
| Nebraska | |
| 1,578,385 | 0.50% |
| 1,711,263 | 8.40% |
| 1,826,341 | 6.70% |
| 1,855,525 | 1.60% |
| New Jersey | |
| 7,730,188 | 5.00% |
| 8,414,350 | 8.90% |
| 8,791,894 | 4.50% |
| 8,864,590 | 0.80% |
| Illinois | |
| 11,430,602 | 0% |
| 12,419,293 | 8.60% |
| 12,830,632 | 3.30% |
| 12,875,255 | 0.30% |
| Ohio | |
| 10,847,115 | 0.50% |
| 11,353,140 | 4.70% |
| 11,536,504 | 1.60% |
| 11,544,225 | 0.10% |
| Pennsylvania | |
| 11,881,643 | 0.10% |
| 12,281,054 | 3.40% |
| 12,702,379 | 3.40% |
| 12,763,536 | 0.50% |
Now, a list of the B1G states in pure rank order, with growth rates from 2010 to 2012:
| Illinois | 12,875,255 | 0.30% |
| Pennsylvania | 12,763,536 | 0.50% |
| Ohio | 11,544,225 | 0.10% |
| Michigan | 9,883,360 | 0% |
| New Jersey | 8,864,590 | 0.80% |
| Indiana | 6,537,334 | 0.80% |
| Maryland | 5,884,563 | 1.90% |
| Wisconsin | 5,726,398 | 0.70% |
| Minnesota | 5,379,139 | 1.40% |
| Iowa | 3,074,186 | 0.90% |
| Nebraska | 1,855,525 | 1.60% |
| 84,388,111 |
What should stand out is that we have have three states with above 10 million people, one with almost that much, one with almost 9 million, then a dropoff. Also, with the exception of basically Maryland, no state is posting super high growth in that time, and the "B1G region" has over 84 million people total. Now, for the region we will inevitably compare ourselves with (and because I am not doing this for the West Coast, so there), here's the SEC state comparison (including prettiness):
| Alabama | |||
| 1990 | 4,040,587 | 3.80% | |
| 2000 | 4,447,100 | 10.10% | |
| 2010 | 4,779,736 | 7.50% | |
| Est. 2012 | 4,822,023 | 0.90% | |
| Arkansas | |||
| 1990 | 2,350,725 | 2.80% | |
| 2000 | 2,673,400 | 13.70% | |
| 2010 | 2,915,918 | 9.10% | |
| Est. 2012 | 2,949,131 | 1.10% | |
| Florida | |||
| 1990 | 12,937,926 | 32.70% | |
| 2000 | 15,982,378 | 23.50% | |
| 2010 | 18,801,310 | 17.60% | |
| Est. 2012 | 19,317,568 | 2.70% | |
| Georgia | |||
| 1990 | 6,478,216 | 18.60% | |
| 2000 | 8,186,453 | 26.40% | |
| 2010 | 9,687,653 | 18.30% | |
| Est. 2012 | 9,919,945 | 2.40% | |
| Kentucky | |||
| 1990 | 3,685,296 | 0.70% | |
| 2000 | 4,041,769 | 9.70% | |
| 2010 | 4,339,367 | 7.40% | |
| Est. 2012 | 4,380,415 | 0.90% | |
| Louisiana | |||
| 1990 | 4,219,973 | 0.30% | |
| 2000 | 4,468,976 | 5.90% | |
| 2010 | 4,533,372 | 1.40% | |
| Est. 2012 | 4,601,893 | 1.50% | |
| Mississippi | |||
| 1990 | 2,573,216 | 2.10% | |
| 2000 | 2,844,658 | 10.50% | |
| 2010 | 2,967,297 | 4.30% | |
| Est. 2012 | 2,984,926 | 0.60% | |
| Missouri | |||
| 1990 | 5,117,073 | 4.10% | |
| 2000 | 5,595,211 | 9.30% | |
| 2010 | 5,988,927 | 7.00% | |
| Est. 2012 | 6,021,988 | 0.60% | |
| South Carolina | |||
| 1990 | 3,486,703 | 11.70% | |
| 2000 | 4,012,012 | 15.10% | |
| 2010 | 4,625,384 | 15.30% | |
| Est. 2012 | 4,723,723 | 2.10% | |
| Texas | |||
| 1990 | 16,986,510 | 19.40% | |
| 2000 | 20,851,820 | 22.80% | |
| 2010 | 25,145,561 | 20.60% | |
| Est. 2012 | 26,059,203 | 3.60% | |
| Tennessee | |||
| 1990 | 4,877,185 | 6.20% | |
| 2000 | 5,689,283 | 16.70% | |
| 2010 | 6,346,105 | 11.50% | |
| Est. 2012 | 6,456,243 | 1.70% | |
And in order:
| Texas | 26,059,203 | 3.60% |
| Florida | 19,317,568 | 2.70% |
| Georgia | 9,919,945 | 2.40% |
| Tennessee | 6,456,243 | 1.70% |
| Missouri | 6,021,988 | 0.60% |
| Alabama | 4,822,023 | 0.90% |
| South Carolina | 4,723,723 | 2.10% |
| Louisiana | 4,601,893 | 1.50% |
| Kentucky | 4,380,415 | 0.90% |
| Mississippi | 2,984,926 | 0.60% |
| Arkansas | 2,949,131 | 1.10% |
| 92,237,058 |
US chart for comparison:
| 1990 | 248,709,873 | 9.80% | |
| 2000 | 281,421,906 | 13.20% | |
| 2010 | 308,745,538 | 9.70% | |
| Est. 2013 | 316,057,000 | 2.40% |
So, the takeaway is thus: The SEC states right now have a few million more people (only like 8), and lots of those states are fairly small and not even growing very fast, as they only have three states with more than 10 million people, and none of the others are close. However, look at the numbers for Texas especially, and to a lesser extent Georgia and Florida. Those are growth percentages from 2010 to 2012. There are B1G states that have put up those percentages in a decade, on much smaller numbers. So, in one sense the demographic issues we are facing are real, but picking up a school in a state that is fairly large but stagnant in growth (Jersey), and another (couple) schools in a state that is growing fairly fast but only the size of Minnesota (Maryland), don't really seem to be the smartest move for the conference from a simply demographics view (there are wealth discussions to be had, but that is not within my purview).
So, we are thinking "Ah, ah, make the population stagnation stop!" Well, in an effort to not bitch aimlessly, I give you this:
| Virginia | |||
| 1990 | 6,187,358 | 15.70% | |
| 2000 | 7,078,515 | 14.40% | |
| 2010 | 8,001,024 | 13.00% | |
| Est. 2012 | 8,185,867 | 2.30% | |
| North Carolina | |||
| 1990 | 6,628,637 | 12.70% | |
| 2000 | 8,049,313 | 21.40% | |
| 2010 | 9,535,483 | 18.50% | |
| Est. 2012 | 9,752,073 | 2.30% |
Ah, fairly large states with fast growth. Whew. Anyway, since many of you will skim to the last paragraph to avoid tl;dr syndrome, in summary I say: while it's true the B1G population numbers weren't really growing fast either compared to the US or the bigger SEC states since 1990 (the smaller SEC states were really a wash), the states we picked up at the moment don't really fix the problem, except maybe in terms of just bringing in current people (as a side note, our population is much more spread out than that of the SEC in terms of evenness). However, many have said that the next move on the part of the B1G is moving South (I don't disagree with this, but it might take quite a while, as I have argued before), which brings the double boon of adding large, fast-growing states, and also preventing the SEC from getting them (the issue of VA Tech going SEC is something I am just going to call a wash and ignore for now), and that's probably the only longer term solution if this is really seen as a problem that needs to be combatted. I am not saying anything profound that we haven't discussed ad infinitum here and elsewhere, but I did want to put some hard numbers on it so we can see the scope of the issue.
I wonder what this would look like if you divided the populations of each state by the number of BCS programs per state. I mean, if you take states like Michigan or Illinois, you can easily characterize them as "Big Ten states" because all of the BCS-level programs in those states are from the B1G. You can similarly call Alabama or Arkansas "SEC states" by the same logic. But you can't really do that with states like Pennsylvania or Georgia.
If we just take Florida and Texas, for instance, you have eight BCS-level programs between those two states, only two of which are in the SEC. So if we give the SEC just 25% of the populations of Florida and Texas, now we are talking about 11 million people instead of 45 million.
Texas has more people than the bottom 6 states in the SEC combined - Wow.
There are only about 45 countries in the world with more people than Texas and they are dwarfed by California. Always interesting to look at these comparisons.Heck, Texas even has more people than Australia.
It's a big place. Texas covers a larger land area than every European country except Russia.
I will say that with Florida, a not-insignificant portion of that growth is due to reitrees. The number of births are on the rise, but pure population numbers can be misleading from vacation and retirement-centric locales like Florida.
That said, interesting stuff. The addition of Texas definitely adds to the SEC footprint, but Texas is so open to competition that you really can't consider it a core part of any conference. Most of the Big 12 recruits from there, as does the Pac-12, Big 10, and ACC. Like California, it produces enough talent to outfit a number of programs, and the SEC definitely won't ever hold a monopoly like they do in places like LA and MS.
I will say that with Florida, a not-insignificant portion of that growth is due to retirees.
I was thinking the same thing when I was reading through the OP post.
If we really wanted to drill into this deeper, then taking into account the birth rates of each region would be required.
There's just a ton of variables that factor into the broader question of what kind of football talent base a region might produce -- the number of football-age boys; the relative popularity of football vs. other sports such as soccer; and the general propensity of a region's football kids to want to stay local vs. stretch their wings and leave home. I don't know how to get a handle on those numbers.
My general sense -- based on not much, to be honest, other than gut -- is that the recruiting picture is getting more fluid and the concept of regionalism is starting to blur.
Perhaps what this tells us is that in pure population B1G is on par with SEC. The other thing this neglects is the fact that the number of D1 recruits produced per capita isnot constant from state to state. For example Both Louisiana and South Carolina produce more D1 recruits than Michigan (IIRC) but have only half the population.
Emphasis on certain sports counts. Michigan has a lot of D1-level athletes that focus on basketball, due to weather, regional preferences, etc.
The B1G has enough people to compete with the SEC. It even has enough young males to compete with the SEC. It even has enough D1-level athletes to compete with the SEC. What it does not have is enough of these guys that play football 7/24.
The SEC has the same situation in basketball. Given its population and growth, it should dominate in basketball. But it doesn't.
Just to add to this, if you added the Pac 12 territory, I suspect the growth numbers would look better than the south. Every state in the Pac 12 grew by 10% or more from 2000 to 2010, even California, which has almost 40 million people.
That being said, the culture just isn't there to compete with the south, where it's all football, all the time.
Florida's growth goes well beyond all the snowbirds going there for the winter. (I'm not sure if they even count as permanent state residents in the census or not.) Florida is a major destination for immigrants from the Caribbean and Latin America. The Haitian community in particular has really embraced football. That community barely even existed in Florida 30 years ago. Now it's one of the biggest ethnic groups in South Florida and has produced tons of college players, and quite a few NFL players, too.
^^^ This is an important chart in this discussion. Just counting the state of Maryland in the B1G's demographics shortchanges the conference. With Maryland comes DC and Northern Virginia (most of Virginia's size and growth comes from the Northern Virginia suburbs of DC). These are now viable "B1G country".
Likewise, with New Jersey comes NYC to some extent.
We (Michigan) have already seen our recruiting pick up in these areas, and it will only get better as they become more B1G-focused.
Population for NY was missing from the tables here, since Rutgers is not in NY. But bringing in Rutgers is the B1G attempt to bring in the whole NYC metro area, not just NJ.
Speaking of metro areas, I think that's how we should view competition with the SEC, not by state population. I have data on the 51 metro areas with more than 1 million people in the US. If you include NYC, the B1G footprint has 13 metro areas totalling 63 million people; the SEC footprint has 14 metros totalling 45 million.
Even with the demographic challenges, that's advantage B1G. The conference will be well-positioned to become viewed as the nation's college athletic conference, viewed by more than any other, and building a national profile that will help it overcome the demographic challenges.
and obviously Rutgers doesn't get in unless there was some thought it would bring in NYC, but it seems a much less effective way to do that than bringing A&M was to get the Texas areas. BUT, if the whole goal was to just get on TV there, then maybe it was somewhat effective.
But if we're talking football recruiting, NYC isn't very productive - a lot of high schools there don't even field football teams. D.C. is quite productive though.
and from FL I can think of Miami, Fl. Fl. State, USF, FCU so I'd say your math is a bit off. True, not all are in the SEC, with only one school in ea state being a member of that conference. And you're also trying to dismiss non-football playing residents for those two states, but you are not doing same for states like MI, OH, PA, NJ, our largest four. I think it's safe to say the number of kids enrolled in the D1 programs of both of these states, outnumber the entire population of certain states in both conferences. The importance of playing in front os so many "potential" D1 players can't be exaggerated and these two states alone allow for a high percentage of recruits to participate in bowl games in front of famililiar faces they've known since childhood. Nabbing a TCU or USF would have made a hell of a lot more sense in regard to an upgrade in both number of t.v.. sets plus football talent.
We should probably also take a look at the African-American populations in these states, since most elite recruits are black. Mississippi and Louisiana don't stand out when you look at the table above, but they produce D1 players at a huge rate. Not coincidentally, they have two highest percentages of black residents in the country (37% and 32%, respectively).
There are many caveats associated with the info presented by the OP which the board has already started to point out. The split of Florida, Georgia, and South Carolina with the SEC and ACC. The split of Texas with the SEC and Big 12. That said, the B1G has a few caveats as well, Pennsylvania split with the ACC (when Pitt moves) and Iowa split with the Big 12, NY's history of being a pro sports market vs a college sports market (except in basketball).
Since those things are not quantifiable with the data provided, I thought I would take the data provided and point out a few trends which are undeniable and support why the B1G made the moves they have. There is nothing new here as Delany has flat out stated the demographic and TV reasons for the additions of Rutgers & Maryland and why they are looking at Virgina, Carolina, and Georgia.
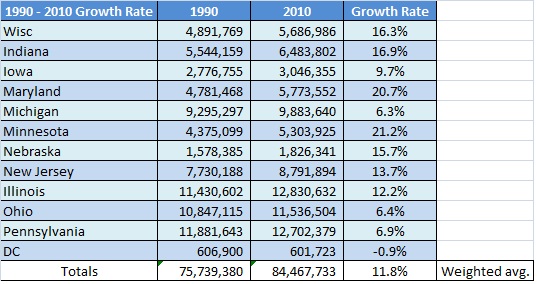
Without further disclaimers. I suggest the data is best viewied looking at three things. 1) the shift in population from 1990 - 2010 to see what the major trend has been over the past 20 years. 2) the short term shift from 2010 - 2012 to validate if the long term trend is still current. 3) comparing the weighted averages of the change since that more accurately addresses the true size of shift.
Here's the B1G from 1990 - 2010:
Here's the SEC from 1990 - 2010:

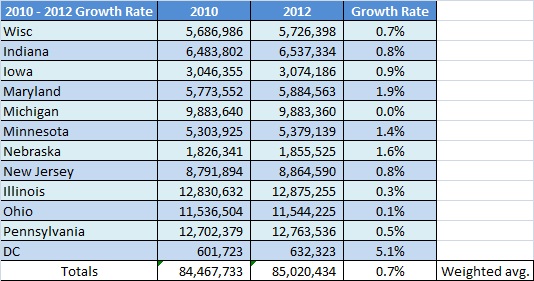
Here's the B1G from 2010 - 2012:
Here's the SEC from 2010 - 2012:
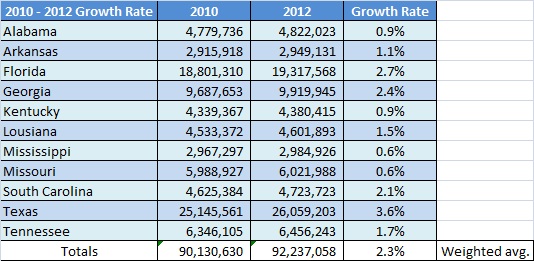
That difference between the B1G and SEC in weighted average from 1990 - 2010 is not pretty. Of course, we all know this as Delany has repeatedly mentioned the huge shift over the past 20 - 30 years. Looking at the shorter term outlook is not pretty either. A 2.3% shift vs. .7% over two years on that big of a base is a BIG (note: not B1G) difference.
For those who want to push the "but they are all old retired people who don't care" argument. That argument held water in the 80's. It doesn't today. The most recent census data indicated the population in the south was a younger population than in the north. In association with the large growth expectations and the avg age of that growth, the economic base has also shifted. It's not just the eyes (on TV's) and butts (in seats) that has moved south, the money (to buy merchandise) is moving there as well.
Since the B1G can't just up and move the schools to where the population trends have been and are heading, they were in a bit of a desperate situation. I'm still not overly enthused with Rutgers and Maryland, but you can start to see the B1G did not have as many options as we as fans may have liked. It also explains why Delaney is sitll dreaming up ways to solidify new market opportunities which still match B1G values and some sense of proximity.
How the business is run... Florida has always been sunny, demographics are more of a meltiing pot than they ever were due to mobility of families these days, internet provider for superior research, and more money being thrown into the college football arena. What most of us don't want to admit is that the B1G has been remiss in its planning, and turned into a relic of sorts. The SEC at one point in time was just trying to keep up, and then...they passed us flying by. If you don't believe this, just take a look at the name of the conference, it hasn't been ten members in over twenty years! Change the conference name! Look at how long it took the B1G to develop a conference playoff system (or even come up with the idea...that we actually stole from the SEC). Michigan is the prime example of sitting on ones lower posterior and thinking that NAME and PRESTIGE alone will keep things going. The largest stadium in the country had horribly antiquated press boxes up until just a couple years ago, scoreboards were nostalgic (rolling eyes). Most of us who grew up in Ann Arbor have an appreciation for these things, because we lived them, don't expect some kid from FL or TX to appreciate them. I've been to several college stadiums growing up just because of the travels my parents put me through and it aMAIZED me just how long my beloved UM was able to hang on. The Swamp is incredible, and small, but they had facilities that trumped UM decades ago as far as technology was concerened. Even the Terps in MD., seemed to be stepping up the pace and that was back in the 90's. The business of UM football, and B1G football has been mismanaged and now we're playing catchup. The best thing that happened to our prgram within the past 10yrs was the "Under The Lights" game in 2011. It put Ann Arbor back on the map, as a destination to play again. It wasn't just because of the lights either, it was the marketing that Brandon did to make it eye catching, and unique.
Putting lights up for a night game... sounds like a movie with Kevin Costner. (Rolling eyes at Dave Brandon), DB isn't a genious but I'll give him credit for watching Field of Dreams enough times to understand the prowess of UM night games.
Is interesting to read expansion speculation. It's sad how clear it is that market dollars drive these decisions. I look at UNC and Virginia (because Virginia Tech, while being more competitive athletically, doesn't fit the B1G profile as a highly rated research university, while Virginia is among the best) and I don't get all giddy. Yes, UNC is a historic powerhouse and they would step into some very natural rivalries with Maryland, MSU, UM, Indiana and OSU, but the football team, while makingh efforts to be relevant hasn't done a ton to impress me. Virginia is far worse, having made it to the Big Dance and a bowl game one once each in the past five years. Much of the same as Rutgers and Maryland. But B1G lacrosse would be amazing.
But as you note yourself, it's not just market dollars driving this, or else schools like Va Tech would be on our radar. We do at least maintain a desire to keep up our academic prestige - unlike the ACC, which was happy to take Louisville.
No wonder that the population of cities is growing. The world is overcrowded and urbanization level is growing significantly all over the globe. On this site, you can check statistics of the population of different countries. And this tendency is worldwide.
Comments