A Potential Model Of NFL Draft Behavior
A POTENTIAL MODEL OF NFL DRAFT BEHAVIOR
As the next installment on an admittedly slow-moving series of diaries on the NFL Draft, I’ve decided to do the behavioral component of this study next. I have always been fascinated by the talk – the endless talk – in the run-up to the draft about who should go where, when you draft certain positions, and the like. I decided to look at it from a league-level view – it would be a little tedious to break it down to individual teams, and indeed the individual needs of teams vary from year-to-year and while it would be interesting to track a specific team to see if they’ve got developmental issues at a position, it is easier for purposes of a diary to see what the trends look like by position and round.
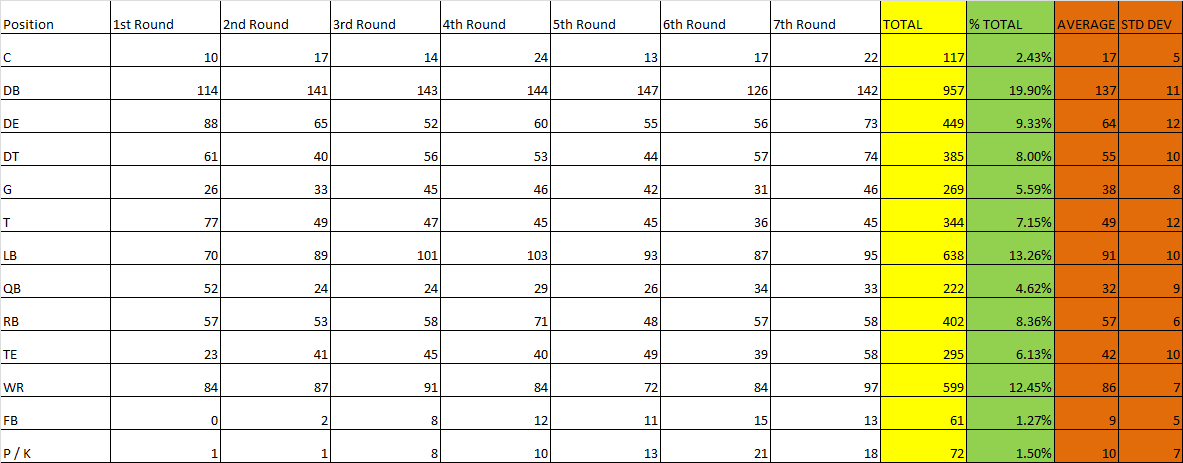
Building on data that I already had collected – from 1995 to this year’s draft, I first built a table by position or position group in the case of DB (too few players listed specifically as CB, FS or SS for it to be telling in their case) or P / K (which I combined for a similar reason) and totaled the number of players drafted in each position or group by round (n=4,810 in this study). There were some interesting things merely in the raw data:
Significantly more than any other position group, defensive backs of one kind or another are the most common in the NFL Draft per this sample. 957 of them, in fact, have been draft in the last 20 years in various rounds, close to one-fifth of all drafted players in that period. The next two in order of appearance in the draft should not surprise anyone, I think – linebackers (638, or 13.26%) and wide receivers (599, or 12.45%). What the table above is showing, of course, is mere totals and as you can see, some areas have a relatively steady hum of activity if you look at it like that. Another level of analysis was needed.
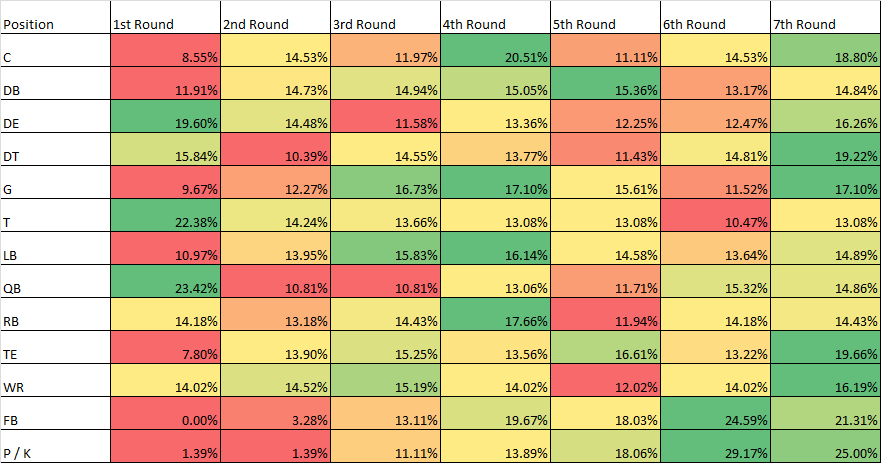
Here is the breakdown in terms of percent of total by position or group and by round:
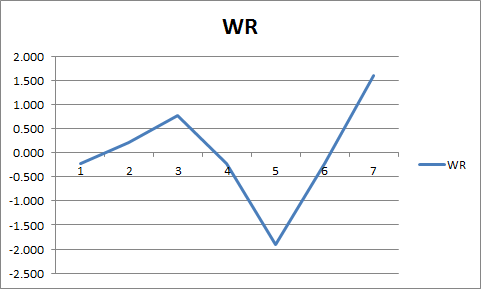
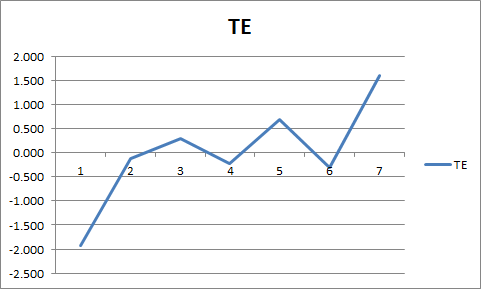
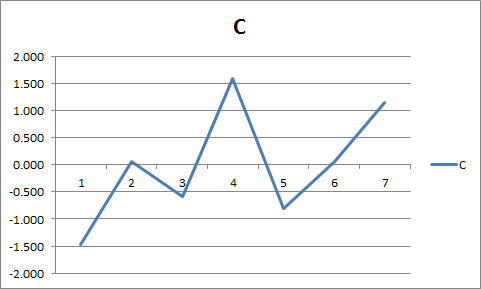
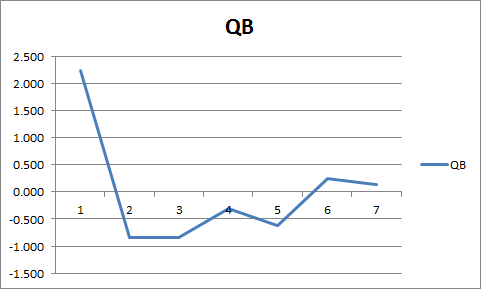
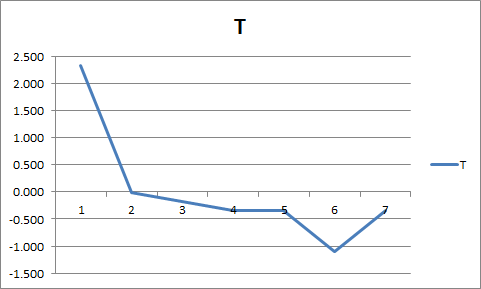
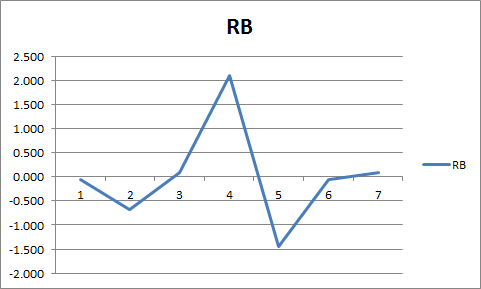
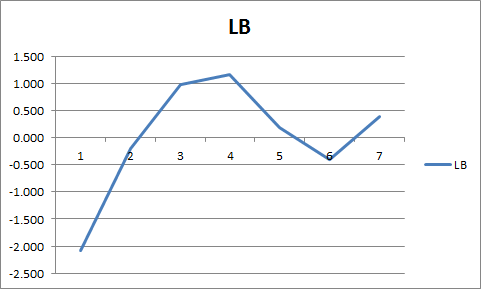
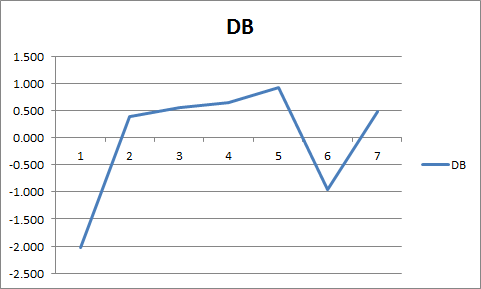
Now, this is more interesting. You can see in the first round, for starters, a higher level of activity at defensive end, offensive tackle and quarterback, which you might expect. The second round tends to be a hodge-podge, if this data is telling us the right story, and then in the third round, activity picks up for offensive guards, linebackers and wide receivers. Running backs spike in the fourth round and you start to see a slight peak for tight ends in the fifth round. The seventh round is simply filling needs, hence the glut of green.
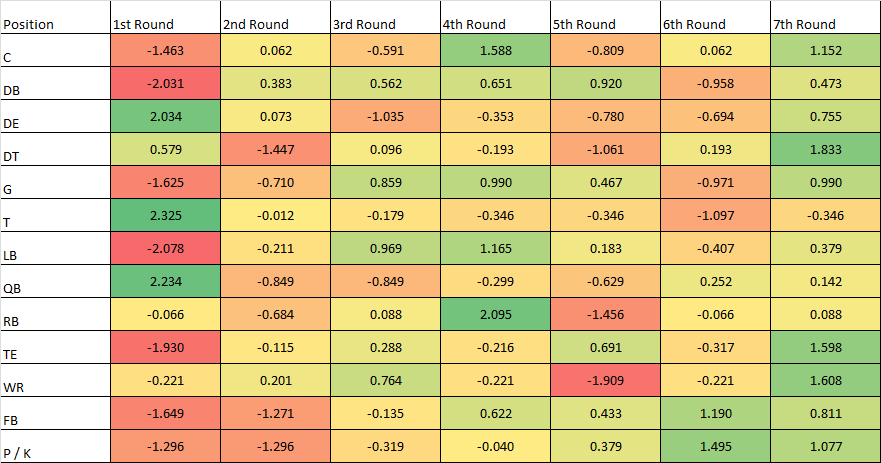
To get a cleaner look at tendencies by position, I normalized this data by position and here’s that table:
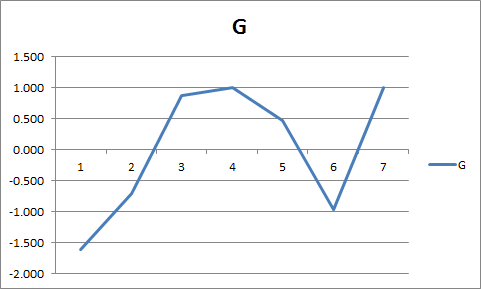
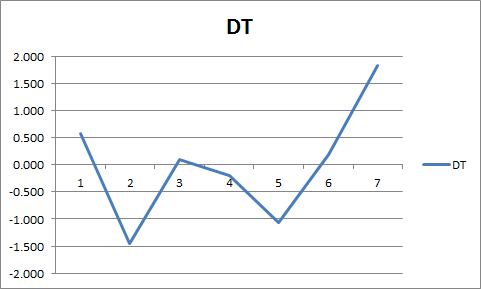
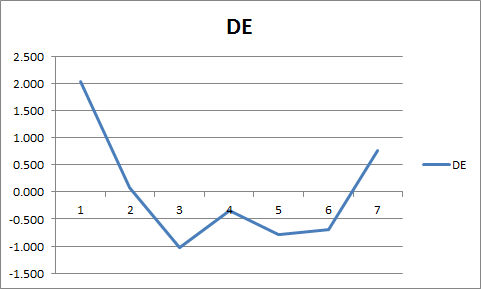
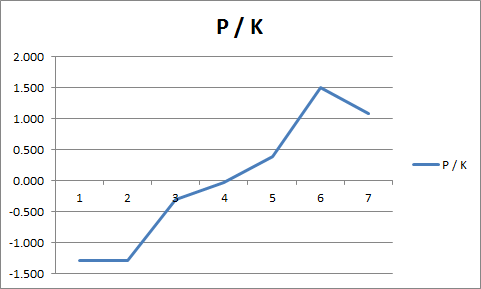
It’s telling you a similar story to the second table, but what you are seeing here – for those who are not stats people – is the number of standard deviations above or below the average amount of players taken by round. This was merely to show in more stark terms where the spikes in activity were at various positions. Those individual graphs are below:
One thing I intentionally left out is longsnapper. This is not because I have anything against them, of course, for indeed as we know in Ann Arbor, they sometimes make serviceable wide receivers in a pinch (see Sugar Bowl for details). It is because – and this might just be a problem with the Pro Football Reference database – there has been only one longsnapper drafted in 20 years of draft data. Again, it might just be the database, but I nixed it because there are too many people like me here who would see n=1 for a position and grumble.
As with most of my diaries, I don’t have a particular conclusion here – there’s not really a message in this data other than that there seem to be definite trends in draft activity by position, and quite a bit of that is determined by teams trading up or trading down as well, but teams do that with specific players and/or positions in mind, so that strategy is not necessarily confounding anything here, in my opinion as there are oft-debated informal guidelines about where to draft various positions.
In any case, if this a reasonably accurate picture of modern draft behavior, then it is interesting to see what more than 30 teams’ combined draft strategies is producing.

How many players have been drafted to play primarily on special teams? The Lions brought in a bunch of kick and punt returners pre-draft. Abdullah may pull double duty, but they might have taken someone just as a returner in a later round. Same could be true with long snappers. They could be listed at another position, but their primary value is at LS. It's probably still a small number given the NFL roster size.
I actually thought about this during a meeting I was in earlier - I wonder if it explains, at least in part, the resurgence in popularity of wide receivers in the last two rounds, for example, where some of the players to fill these roles come from. It would be difficult to flesh out unless you knew the fate of every single player in the draft, I think, but this is an interesting question, in my opinion.
They give you time to think about football.
For long snappers in particular it seems unlikely that they'd be drafted from another position group just to play LS. They're barely LB-sized on average in the NFL.
Seems like draft position correlates pretty strongly with "freakish size" factor.* There are just a lot more 6'3, 300-pound guys (OG) than there are 6'7, 315-pound guys (OT). You're taking a risk either way because scouting is very imperfect, but the pool of guys who can play OT is smaller than the the OG pool, so you make riskier bets on guys who could play OT. Same for DE: there are only so many dudes with Julius Peppers's or Jason Pierre-Paul's measurables. QBs are the exception because their position is the most difficult to play, so the pool is small for a different reason.
By comparison, there are a LOT of 6'3, 245 pound guys out there who can't run very fast or push very hard but who could learn to snap a ball 15 yards. No need to take a chance in the draft when you can use that chance on a guy who's a rarer bird.
*NB: This theory owes its existence to the various people who explained to me why taking a probable OG in the top five isn't the greatest idea. It does seem to be borne out by the charts in the OP.
Thanks LSAClassOf2000 for this excellent post. I love draft analysis work. One question I have about this is how the frequency of positions on NFL rosters affects things. I'm thinking there are probably 3-4 DBs on a roster for every C. Thanks again and keep up the EXCELLENT Posts!!!
If you ain't first, you're last in the defensive line world.

Comments