Outkicking Your Coverage: Non-SEO Edition
The Michigan Difference: seeking input on offseason article topics and the first request being about punting and then getting a quick second! Ask and you shall receive.
MGoUser stubob asked whether or not outkicking the coverage on punts was a real thing and if there was an optimal distance to kick the punt. To look at this I looked at all “returnable” punts. Punts kicked from at least the 20 yards and that did not go further than the opponent’s 10 yard line and occurred in the first half of the game unless otherwise noted.
The Mode
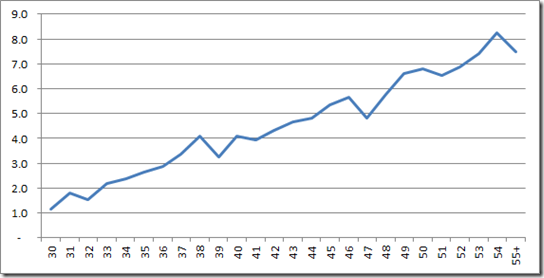
Unsurprisingly from the original hypothesis, the longer the punt, the longer the average punt return.
Average return yards/punt given punt distance
Initially, it does look like longer punts yield longer returns. Of note though is that the slope is significantly flatter than a 1 for 1 trade. The rough slope is that for every four yards of distance you add to the punt, you give back a single yard of average return (not counting touchbacks). This accounts for the average case, but doesn’t address the risk and variance.
The Big Return
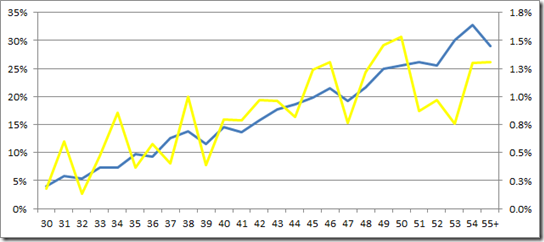
Percent of returns going 10+ yards (Blue) and for TDs (Yellow)
Again, the data backs up the conventional wisdom on long punts. A 55+ yard punt has a one in four chance of coming back at least 10 yards. With an average return of 7+ yards this isn’t much of a surprise. The longer returns aren’t just a function of more space between the punting team and the return team. But even with smaller sample sizes, there is a strong trend between likelihood of a touchdown and the length of the punt. Even though the total odds of a 55+ yard punt getting returned for a touchdown is about 1 in 75, that is about 3 times the rate of a 30-35 yard punt.
Strategy Implications
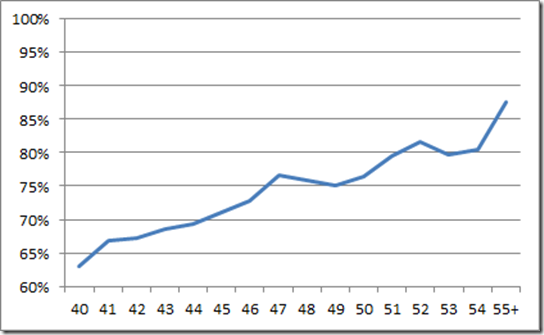
If you look at the net implications of these two charts, the long term strategy clearly points to kicking it as far as you can, concerns be damned. Even when you factor in touchbacks, the odds of a punt netting 40 yards goes up dramatically the longer the kick.
Percent of punts netting 40+ yards by punt distance
55+ yards net over 40 yards nearly 9 out of 10 times, nearly 50% more than a 40 yard kick. Outkicking the coverage isn’t a valid enough fear to push for any decision other than kicking it long, except possibly in a late game situation where the small but increased risk of a touchdown on the return becomes more highly leveraged.
The Spread Punt
One of the few questionable decisions the Hoke era has produced has been the refusal to move to the spread punt. While I don’t have data on which teams have converted to the spread punt when, but if you trend punting data over the last 10 years, its clear that something is happening.
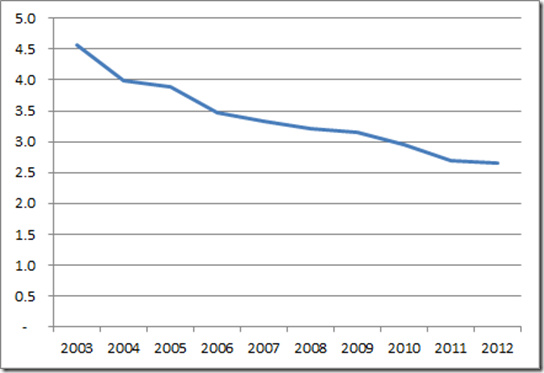
Average return yards per punt by season, excluding touchbacks
Over the last ten years, the average return yards per punt has decreased by 42%.
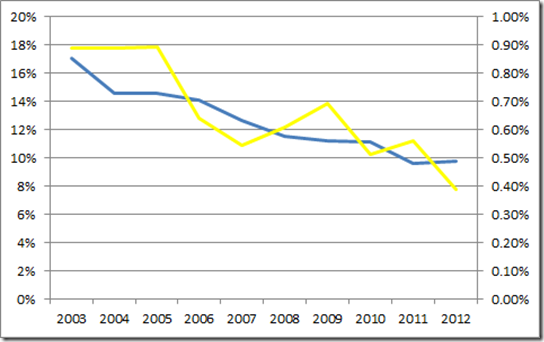
Percent of punts returned 10+ yards (Blue) and TDs (Yellow)
Just like above, the move towards lower return yards corresponds with a lower rate of long returns. The real indication of change comes next.
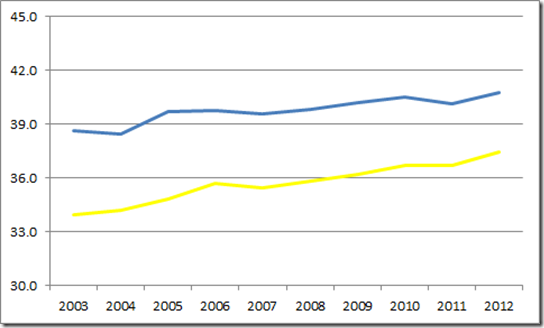
Gross (Blue) and Net (Yellow) punting (including touchbacks)
This generally otherwise uneventful chart shows that over the last ten years both gross and net punting have improved nearly every season. Not only has net punting improved, but it has improved at a rate faster (10.3% cumulative) than that of the gross punting (5.6%), which is the exact opposite effect you would expect based on the fundamental connection between punt distance and punt return yardage. This indicates that over the last 10 years there has been a shift in the basic nature of both the punt and the punt return. Correlation and causation and all that, but this is a pretty clear indicator that the widespread adoption of the spread punt formation has been a huge win for the punting teams.
If we make the weak but directional assumption that 2003 = Traditional Punt and 2012 = Spread Punt, the formation is worth about 3.5 yards per net punt and a 50% reduction in punt return touchdowns. Otherwise of note is that the block rate has dropped along a similar slope from 2.6% in 2003 to 1.0% in 2012. So net punting up, gross punting up, punt returns down, punt returns touchdowns down and punt blocks are down. Whatever has happened between 2003 and 2012 let’s hope Michigan is on board.
April 24th, 2013 at 11:08 AM ^
Outstanding work
April 24th, 2013 at 11:12 AM ^
IMO, to have a valid argument on the spread punt verses traditional punt, you would have to compare M punting from 2003-2012. If the charts of the Michigan teams are similar to the charts above, then there is something else that is causing return teams to suck. Or at the very least, there should be no reason to "jump on board"
April 24th, 2013 at 11:28 AM ^
That's actually going to really limit your sample size and make any conclusions dubious at best. The thing about aggregate data, like the Mathlete used, is that it more or less eliminates the effect of the individual punters. You're suggesting giving the individual punters a lot of prominence, which will affect your results. A great punter can probably increase net yards and decrease return yards through his skill, absent formations. In other words, the biggest predictor of results would probably be individual punter.
April 24th, 2013 at 11:42 AM ^
As you pointed out, this can make for some really interesting late game strategies. You might have to punt it far enough to get a team out of field goal range but you don't want to punt it too far, increasing the risk of a return for TD. Let's hope M wins by 20 every game and doesn't have to worry!
April 24th, 2013 at 11:43 AM ^
You are my most-favorite diarist. This is great.
(with apologies to LSAClassof2000, whose statistical analyses I also hold in very high esteem).
April 24th, 2013 at 12:11 PM ^
And given the number of punts per game, switching from an old-style to a spread punt is worth something like 1-2 points in expectation per game? 8-12 possessions, so, 4-8 punts per game? Maybe only 1 point in expecation?
This is why I love this site! Gerat work!
It truly is a gerat post.
Heiko should work this into the bubble screen line of questioning.
Someone get this Brady Hoke, STAT!
#idkwhatstatstandsfor
Awesome work. Out of curiosity, where/how did you get this data?
I think Hokes main reason for avoiding going to a spread punt is the fact that it limits your ability to run a fake, and I think in his first two years he has established that he is someone who likes to keep the option of a fake kick in play.
Does it, though? I feel like I've seen some successful fakes run out of spread punt formations by other teams, even aside from the rugby punt "if nobody is there when you roll out, just keep running" fakes.
I guess I didn't expect such a random distrubution of TDs for given yardage. If kicking 40 yards gives a 10% chance of TD, and 50+ is only 25%, then kicking deep doesn't seem like a negative.
I mean, it's 0.8% and 1.3%, but yeah, it seems like "outkicking your coverage" is rather overrated.
One major concern I have with your data is that (from your definition) you are likely including punts that go out of bounds. I think to form a more accurate conclusion you should only include punts which are "field-able". Punts out of bounds offer zero chance of return so they sort of skew the return yardage.
Hang time vs. return yardage would have been interesting if Hang Time was available. Maybe measuring the amount of Fair Catches by Punt Distance could help you determine hang time? It seems Fair Catches should be looked at separately too- cases where punt coverage was excellent.
April 24th, 2013 at 11:58 PM ^
Hang time is a far better indicator of the success of a punt and the chance of a return. Ask any football coach in the country and they'll tell you they'd exchange hang time for distance any day.
Mathlete argues the opposite of this logic that either he or Brian has put forth in the past: "even though the expected return is higher, the (kick) receiving team should not take touchbacks because the variance of the return is lower (zero)".
The offense should be interested in high variance, big play opportunities. The defense should be interested in limiting those opportunities, even if that means sacrificing a modest amount of field position on average.
Also, we don't have data for hang time. I'll bet if you did and you could eliminate shorter punts that did not have superior hang time, the results would look different.
Also to assume a "law of large numbers" approach when you only punt ~40-60 times per season and not account for who you're kicking to seems foolish. Look at the separation in Punt Return Yards (Average):
http://www.ncaa.com/stats/football/fbs/current/individual/1022
You conclude Hoke is making a mistake by not going to the spread punt, and you don't give stats comparing the spread punt vesus non-spread punt?
Really?
This isn't a correlation versus causation flaw. This is a "where is the data we need to make a judgment" flaw.
Even if teams are moving to the spread more, there are teams that do and teams that don't spread the ball. How do these teams compare? That's the 1st, 2nd and 3rd questions to ask.
Then there are the correlation/causation questions you can ask as well...
Love the stats and the discussion, but I might frame the discussion as "Is the spread punt responsible for these changes" rather than "The one thing Hoke is doing wrong..."
we should punt better?
got it.
I hadn't read the comments before I made my snark laden post, so I apologize if it appears that I tried to steal your thunder.
So, wait a sec, you're telling us that punting the ball a long way is...good? Next, you'll use a bunch of fancy charts to "prove" that completing a high percentage of passes is also a good thing.
(Sorry, I know everyone here loves charts and analysis but this was simply too easy to pass up.)
...need moar labelz. Srsly.
Is the fumble rate higher for shorter kicks? Do upper class returners fumble less? What is the impact of backing a team into their own endzone to punt distance net and gross? Are we seeing more muffed punts and blocks with the spread punt? Expected points wrt field position is important but not reflected above. What was the outcome of San Diego State's experiment? Mid season Rocky Long changed his tune to the press.
There is quite a bit of cat and mousery behind the numbers. Thanks for this work.
April 25th, 2013 at 10:25 AM ^
A great deal has changed in college football from 2003 to 2012 both in terms of strategy and statistics. Clearly, all differences cannot be attributed to punt formation. Therefore, I do not think you have anything like enough evidence to make this assumption;
If we make the weak but directional assumption that 2003 = Traditional Punt and 2012 = Spread Punt,
That is an interesting hypothesis that has not been even remotely proven in my professional opinion. Real evidence would come from breaking down punts into spread and traditional and demonstrating the difference directly since everyone is not spread punting every time. Even so, teams are selecting a punt formation situationally and might therefore be creating or exaserbating a disparity in return distance through that selection rather than through the actual formation.
Comments