Operating In The Zone: A Look At Consistency
It has been discussed a few times on the board that Michigan is typically very good at dictating the game to its opponents, and there is definitely evidence of that in the team’s offensive efficiency numbers. During the season to date, Michigan has maintained an average offensive efficiency of 1.20 with a standard deviation of 0.163 (0.118 during conference play only), which seems to me to be a relatively narrow band considering that the standard deviation for Michigan’s possessions per game was only 4 against an average of 62 (and 61 possessions with a standard deviation of 3 in conference play). Long story short, the play was relatively consistent in its production and pace. When we talk about how it is vital to impose your will early in a game, there aren’t too many teams that can do it quite in the way that Michigan has.
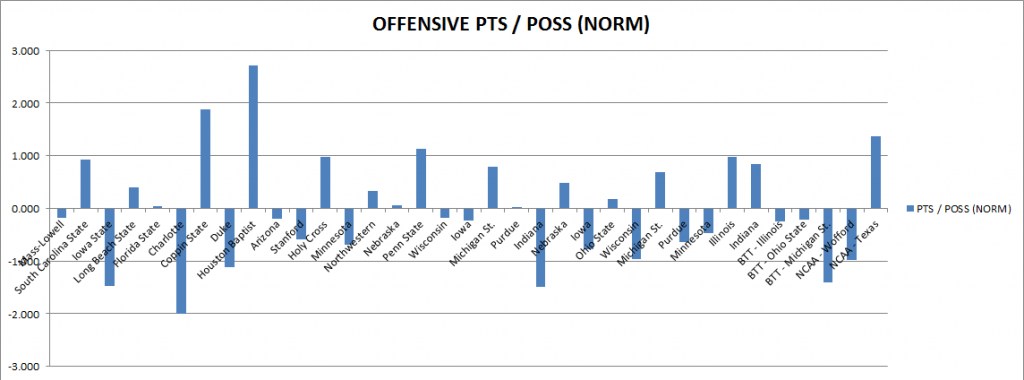
Below is the normalized graph for offensive efficiency:
You’ll note right away the relative handful of games on the extreme ends of performance. There are only four games with a Z-score greater than 1.00, meaning that offensive efficiency was greater than one standard deviation above the mean. On the other end, there were five games where efficiency was more than one standard deviation below the mean, all of them losses.
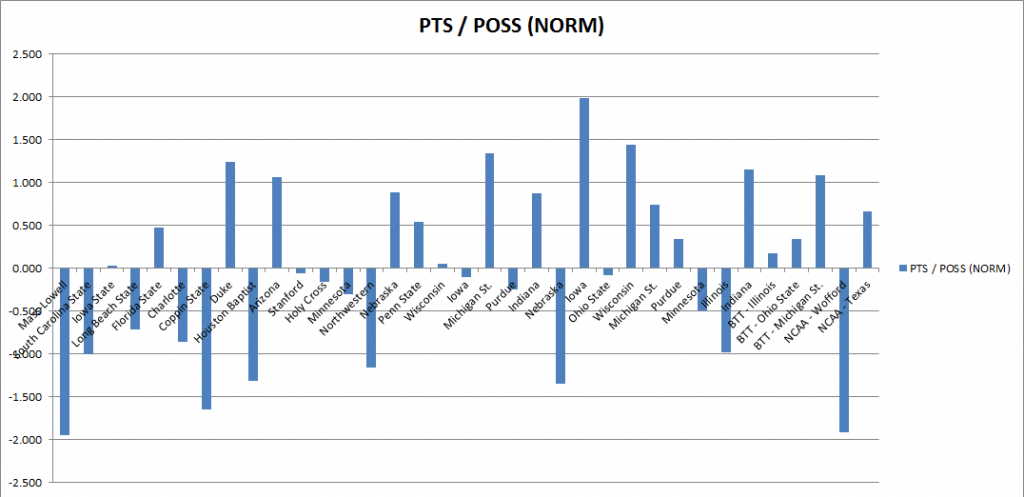
The story is a little different when we flip to defense, of course:
Here you can see a little more in the way of erratic behavior, but for those of us who kept saying that the defense “is what it is”, well, this is it. Interestingly, the distribution has a similar look to the offensive one with a standard deviation here of 0.168 against an average of 1.04. Seven games actually are greater than one standard deviation above the mean compared to six games more than one standard deviation below the mean. There is a marked jump in the number of “extreme” performances in this aspect of the game.
From this data, we can build a nice little set of histograms and get an idea of what the probability distributions looked like for efficiency on both offense and defense, but I would also like to throw scoring margin in here because it is interesting in the case of Michigan. Actually, let’s discuss that first.
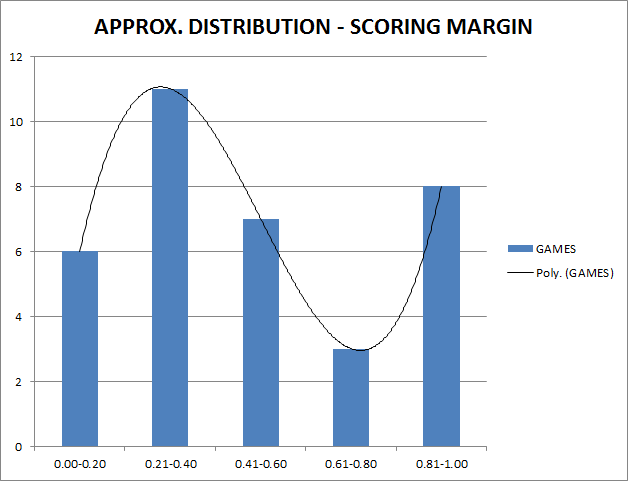
For each of these next graphs, I broke the cumulative function into fifths (hence, for example, “0.00-0.20”, which represents the first fifth of the total area under the curve) and made the histograms based on relative position. For scoring margin, it is important to note that for the season to date (postseason included for giggles) our average margin is +9.45 points with a standard deviation of 16.08 points.
Here’s what the histogram for scoring margin looks like:
So, what you see here is a lot of close games basically. Indeed, we played in 20 games where the scoring margin was +10 or less (12 of which were wins), compared to only 13 games won by more than 10 points (also, two where the margin was exactly 10 points).
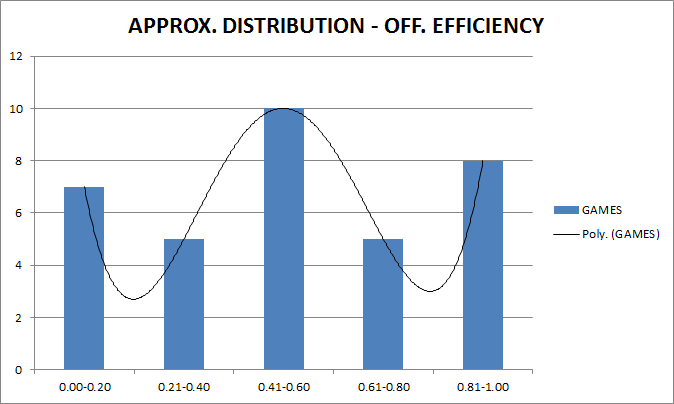
Here is offensive efficiency getting a similar treatment:
Again, the relative steadiness of the offense is seen here. If you look at the three bars in the middle, that more or less represents the two-thirds of Michigan’s games which sit in their “zone” around the 1.20 line, if you will.
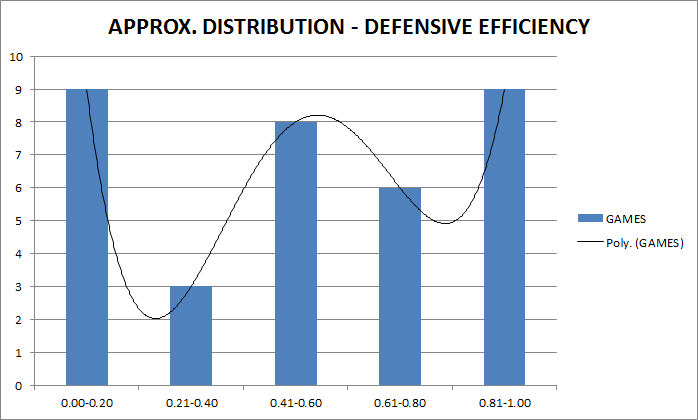
On defense:
Yeah, this one is decidedly wobbly and definitely skewed towards “meh” performances. Many of the games on the left (“better” defensive efficiency, in this case) represent our out-of-conference schedule actually.
CONCLUSION:
Like everything else, this is for the board’s perusal. The only thing I hoped to do was perhaps give some numerical credence to some of the themes on the board of late.
Oh, and here's a gem...Super Mario 3, a cappella...
If you're replying to my way premature (as in, before I had pasted the content into the window) posting, that's my bad. It might be the last time I try to arrow over and hit "Enter" without watching for which button is highlighted. Technical glitch....of the neurological variety.
I hoped you had compared our defensive efficiency when playing man-to-man vs. zone. That would be interesting. I'm not sure what to conclude from this, but it looks like you spent some time on it so thank you for that.
"In The Zone", in this instance, was a cute way to refer to Michigan's ability to simply be Michigan, as shown by the relatively slim variation of tempo and efficiency compared to some other teams. As for the conclusion, I tend to leave that up to the reader.
I like Mario.
SMB 3 . . . good times.
interesting , but I wonder if you have tpp much time on your hands.
but I don't know where to get the data and am too lazy to find it.
My hypothesis is that having six deadly-to-competent three point shooters allows Michigan to be consistent while still taking a dependence on the three point shot.
When you have just a couple of three point shooters, if they are off--you know the saying--"Live by the three, die by the three".
But since Michigan had six--and if they could sense and act upon when they're "on"*, then perhaps Michigan could retain a high degree of consistency in spite of taking a lot of threes.
I was thinking about a comparison of the standard deviation of three point shooting percentages per game across teams, but I think LSAClassOf2000 hit upon the same underlying condition, and probably from a better angle.
*Being able to sense and act upon being in the zone could be (and has been) its own topic.

Comments