OL Experience as Predictor for Success

After the past two games, much discussion has centered around a rapid transition from guarded optimism to total panic in regards to our offense. The relative merits of our interior lineman, in particular, have been debated widely in platitudes as well as UFR minutiae. While Miller is facing a bit of a talent and size deficiency, we all return to the inexperience of these (and other young) Wolverines as a large factor in our offensive struggles. Though not speaking exclusively on the OL, ST3 hammers the matter of "youth" home in his most recent Inside the Box Score.
It’s widely accepted that an experienced line correlates with a successful offense. I didn’t expect to have to dig deep into an MGoSearch to find some statistical evidence accompanied by glorious charts, but the hunt turned up empty other than a 2009 Unverified Voracity linking to a WSJ article confirming the strong correlation. This particular evaluation used combined OL starts as a metric, determining that “offensive-line experience is one of the telltale predictors of success in college football.” I sought out to see how this correlation might look for Michigan and its immediate cohorts: the Big Ten member teams, Notre Dame, and next year’s new kids Rutgers/Maryland. I’ve dubbed this the B1G+.
So how would a lurking, stat-friendly but non-mathletic blog poster make some evaluations? Without data on career starts, I used eligibility year (per rivals depth charts as of 9/26/13) as a metric for experience of an offensive line. True freshman are a 1, redshirt seniors a 5. Herein lies an obvious limitation: "age” and “experience” can be quite different in matters of football.
Given that I’m interested in the effect of a young OL, my metric for success was an offense's yards per play; see Ron Utah's recent diary for another breakdown of how our offense stacks up based on yards per play. The WSJ study used AP poll result to measure success; see LSAClassOf2000 question the legitimacy of this measure. I included data on team RPI to give some sense of overall team strength.
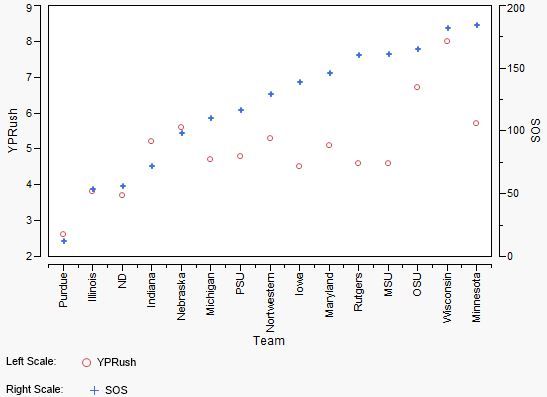
Scientists: I got a B.A. in Psych from LSA and something called “arts and ideas” from the Residential College, so forgive me for my sins. If I understand your process, I'm testing the hypothesis that offensive lines with a greater average age will produce more yards per play. If I understand your caveats, it’s unlikely that my data set is a large enough sample to draw significant conclusions. But I've got a nifty heat map:
(Green = 1+ standard deviation above average, Orange = within 1 standard deviation either way, Red = 1+ standard deviation below average)
The hypothesis would suggest we see a lot more green on the top half of the map (other than SOS, which is mostly for reference). Of teams with older than average B1G+ OLs, Ohio State fits the hypothesis best with Wisconsin a close second. To be fair, 3.8 years into eligibility per OL in Madison is probably closer to 4+ anywhere else. What do they put in the cheese up there?
MSU and Purdue are extreme outliers against expectation. Michigan St. may be explained by the effect of the "age does not equal experience" limitation. If I recall correctly, they have shuffled guys to the line from other positions out of necessity. Purdue... I don't know anything about the makeup of that line, but to be fair their SOS is tops in the B1G+. Note that Michigan is the epitome of an average team across the entire row, including SOS.
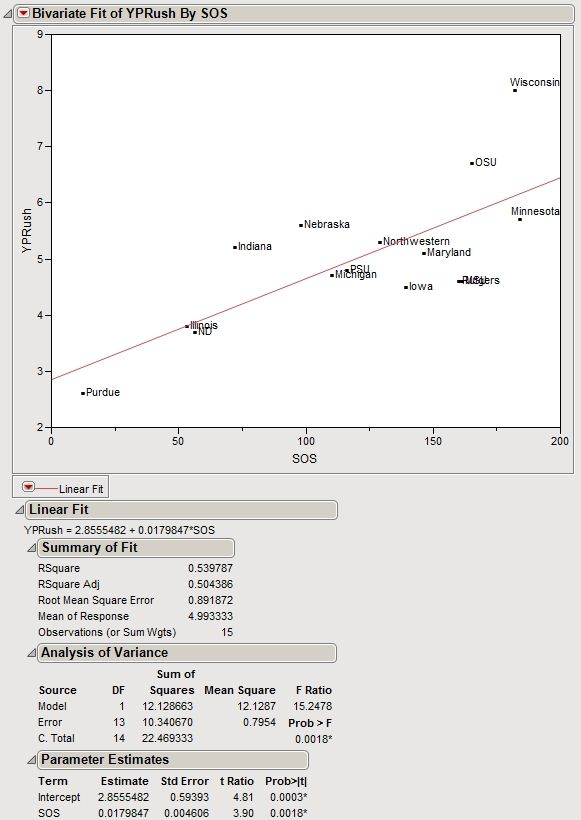
On the bottom half of the map, there are several overperforming young offensive lines. Maryland is cranking out more yards per play than anyone but Wisconsin despite having the youngest OL in the sample. Indiana is having no problem moving the ball against a schedule more difficult than MIchigan. Same for Illinois, though the rush numbers are right on the fringe of going "red," leaving them an average overall offense. Notre Dame's rushing attack is a minor anomaly. How about a scatter plot?
At a glance, the hypothesis is bogus through four weeks of B1G+ action. That's clearly a negative correlation, both across and within quadrants. On the other hand, the trend line looks about right if you throw out Purdue, MSU and Maryland. Michigan is to the B1G+ as David is to man, but Minnesota will be out to prove they are the more perfectly mediocre offense from the most perfectly mediocre conference next weekend.
The tone of the blog after UConn has shifted towards acceptance of our averageness rather than extreme panic or outdated optimism. If nothing else, these cute visuals may lend credence to that MGoStageOfGrieving. Sure, we're not that "young," but we're not that bad either, independently or relative to age/competition.
September 27th, 2013 at 11:57 PM ^
Maybe you need a different stat? 3rd down conversion%? Sacks allowed? The opposite of what mathlete calls "bonus yards"?
September 28th, 2013 at 12:43 AM ^
It will be interesting to see how this plays out as the season progresses.
I have seen OLines with inexperienced players that looked over matched in the first several games of the year work much better as the year progresses and they gain experience working together. Of course, sometimes they remain a liability all season, too.
September 28th, 2013 at 11:49 AM ^
is over. The competition will become a lot tougher. If anything, the Michigan numbers will show a lack of progress.
The above chart validates what many of us sadly have come to recognize. Our OL is barely average.
September 28th, 2013 at 7:55 AM ^
September 28th, 2013 at 10:54 AM ^
September 28th, 2013 at 11:25 AM ^
That is not how science works.
You can have as much bias as you want in your hypothesis, because unless the data and facts back it up, it amounts to nothing. Even if you supply biased data to support it, unless everyone else who recreate your study agrees with you, it won't go anywhere either.
That is why science, in the end, is devoid of biases.
September 28th, 2013 at 1:57 PM ^
Not sure what this could possibly mean. Without a hypothesis, how do you know what data to collect and analyze? Unless you just think choosing a hypothesis should be replaced with choosing a question, in which case you haven't actually changed anything. It's just as likely as not that a chosen hypothesis is being tested because the researchers think it's wrong, and choosing only a question and not "taking a side" just confuses the issue without providing any advantage -- the researchers can still have a bias about which answer they think is correct, but now the results become much harder to interpret, since there isn't a hypothesis with delineated predictions against which to compare the results of the study.
September 29th, 2013 at 11:38 AM ^
I sure hope that yours was the only school to teach that hypotheses are "bad science." Hypotheses are good things, because they give scientists something to disprove. The scientific method requires that the process of investigating a hypothesis be designed to show the hypothesis is wrong - mostly because it isn't possible to show that it is right.
This particular example isn't an example of science, though. This is an example of a "hypothesis" as the common English term (which means a guess that doesn't contradict the known data), and an attempt to see what measures of success conform to the "hypothesis." Bad science, to be sure, but interesting and relevant reading. This isn't a science journal.
September 29th, 2013 at 7:10 PM ^
of your tree. Feynman and Hawkins beg to differ. Don't go muttering this in the faculty or GA lounge in any science department on this campus. You'll be laughed all the way to East Lansing.
Lots of people can crunch numbers; thinking's a little harder.
September 28th, 2013 at 8:37 AM ^
Updating this every 3 or 4 games of the season will be interesting. Both the chart and the scatter plot give an interesting view to this subject and helps all of wanting to know how the O-Line is progressing through the season.
September 28th, 2013 at 10:30 AM ^
September 28th, 2013 at 10:58 AM ^
September 28th, 2013 at 12:52 PM ^
Michigan is underperforming from Gulo's data...
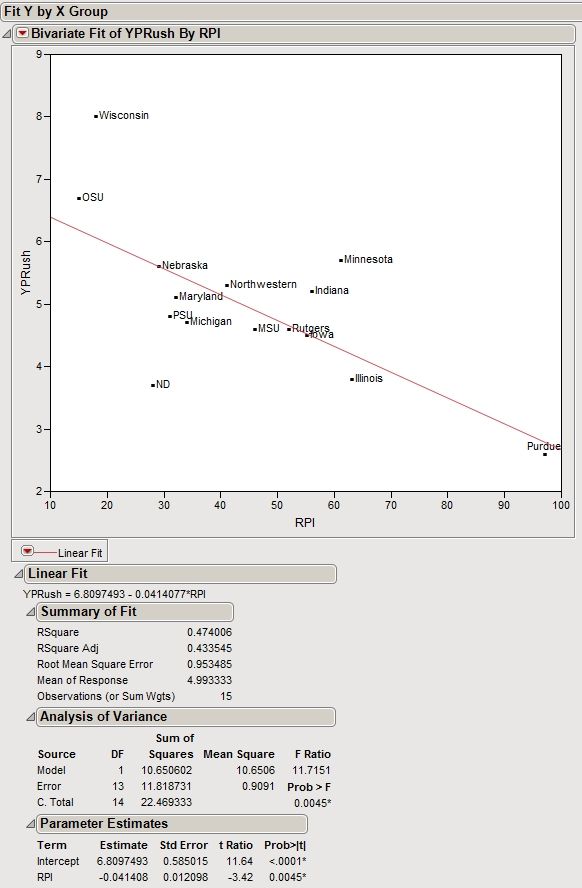
And by RPI...
September 28th, 2013 at 12:14 PM ^
this does not take into account the difference between a spread and a prostyle offense. I would like to see something about inexperienced vs experienced lines over several years at the same school or in the same program.
Like Oregon changes head coaches, but the system lives on. Ditto with Stanford.
But i think the sample size would be insanely small and unreliable.
September 28th, 2013 at 1:59 PM ^
As you point out, this sample is way too small for these results to be meaningful. Talent disparity is more than enough to explain any variance in the analysis, regardless of experience level.
September 28th, 2013 at 5:23 PM ^
Comments