The Micro-Level View Of Downs And Success: Yet Another View
DOWNS AND SUCCESS: THE MICRO-LEVEL VIEW
NOTE: The scales on charts will vary - apologies in advance.
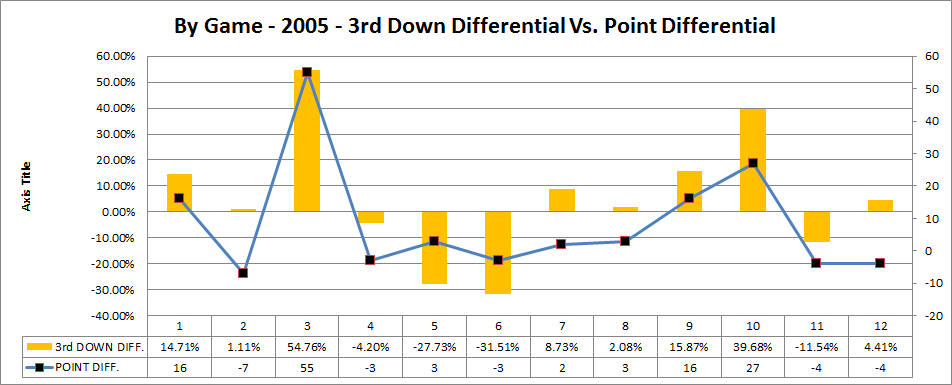
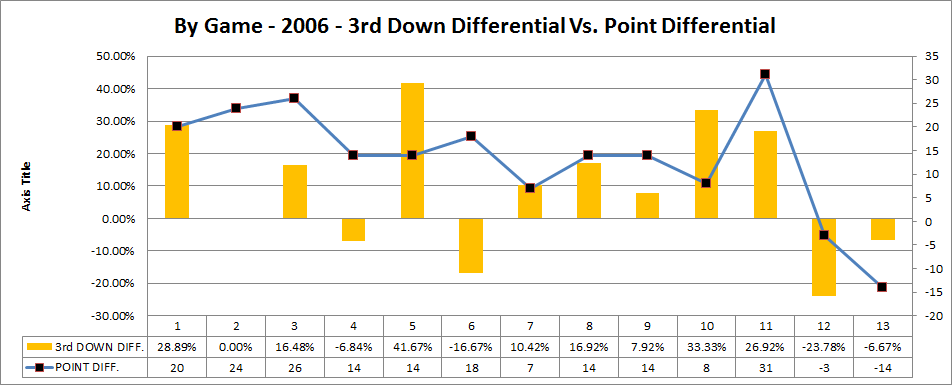
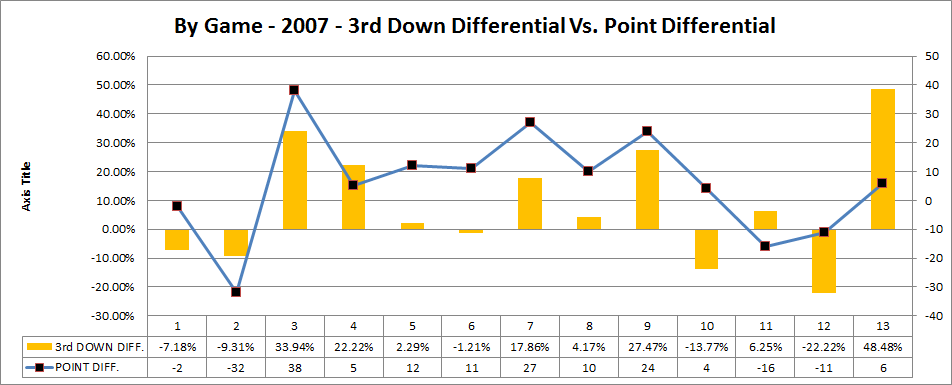
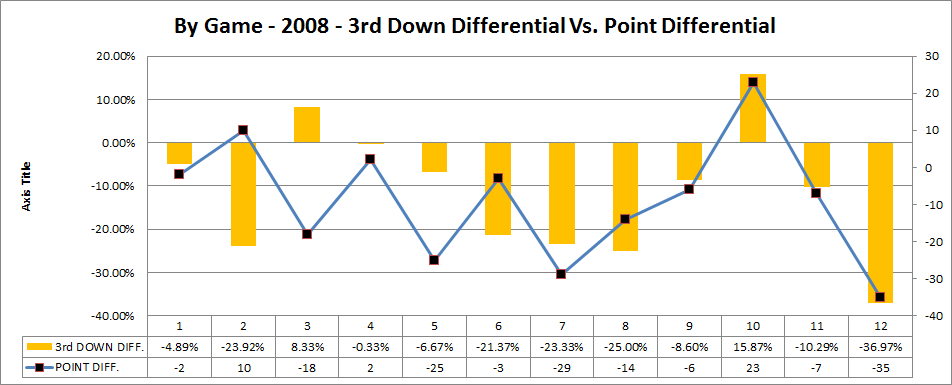
Inspired partially by a suggestion made in the last Dear Diary, I’ve decided to extend this series one more entry. This time, I am going with the micro-level view, using in-game differentials and tracking these with point differentials from game to game. The sample I chose, just to see if there is anything going on within the numbers, is Michigan’s in-game stats from 2005-2012.
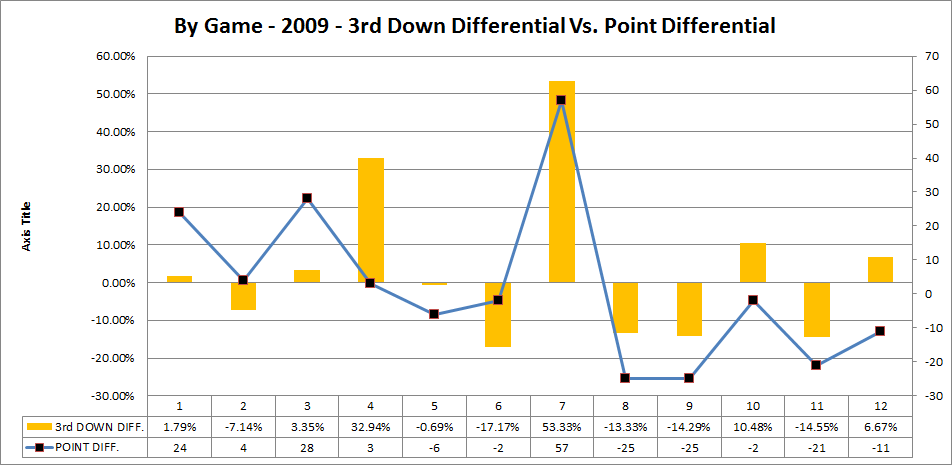
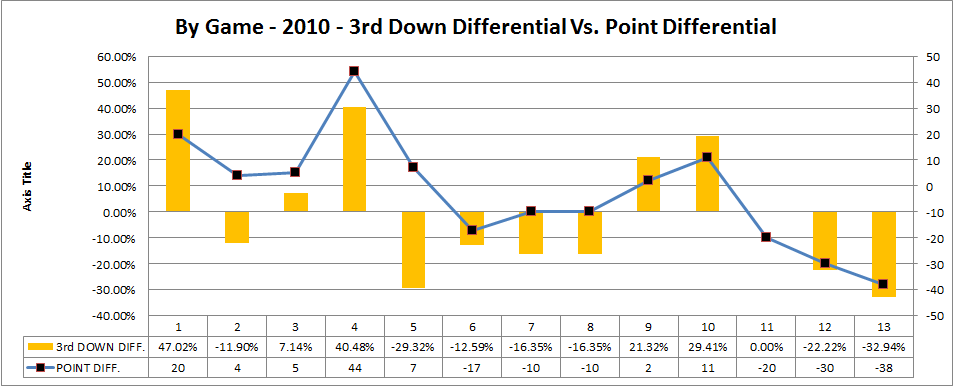
The method for calculating that differential was the same as in the previous entry – the offensive conversion rate minus the defensive (opponent’s success) rate. The point differential would then be simply Michigan’s total points minus the opponent. The idea was to see if they tracked together and, if so, how close is the relationship.
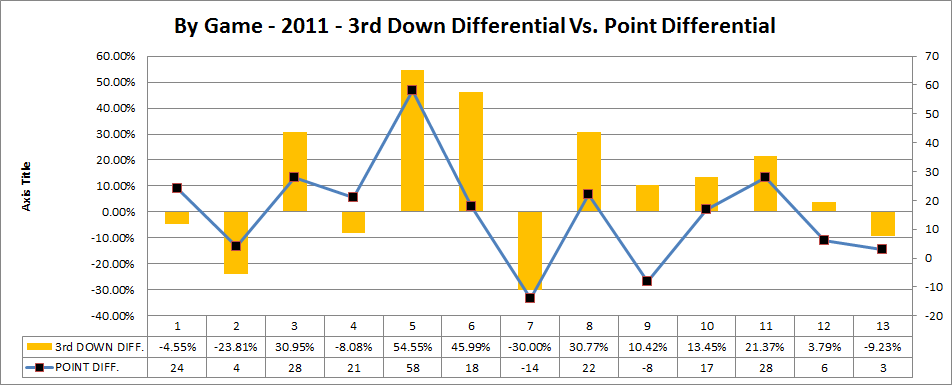
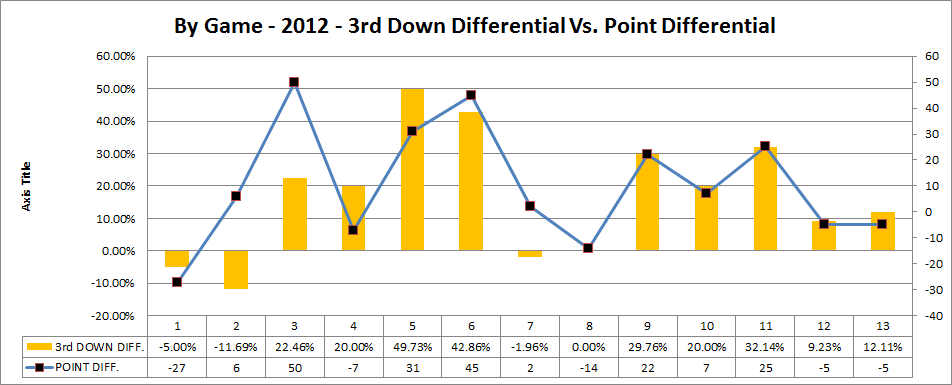
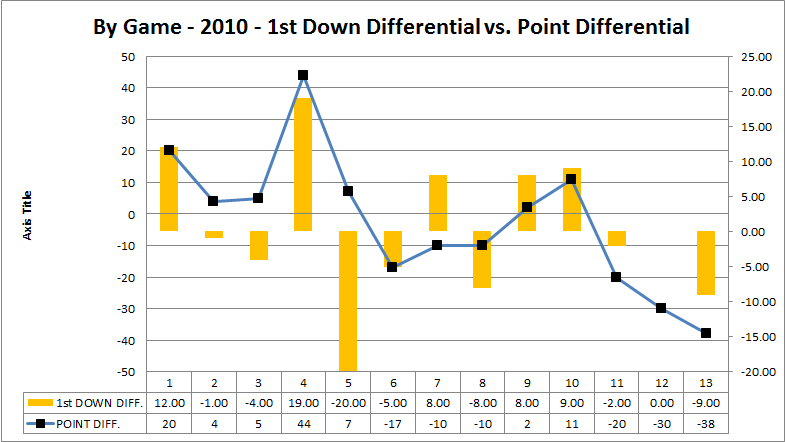
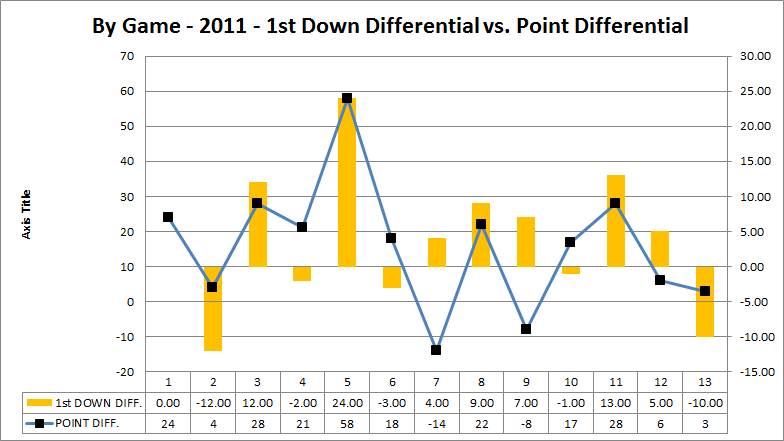
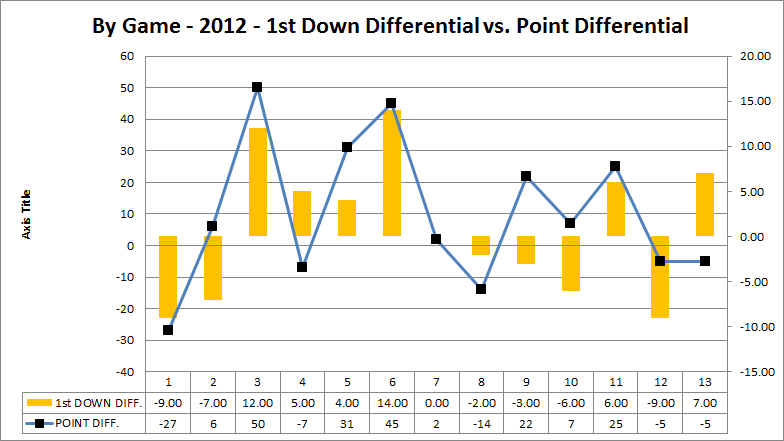
As it turns out, it is reasonably close – for the sample, the R-value came out to be 0.728, so there is a decided correlation between the two variables. It was at this point that I decided to embark on a smaller side comparison of first down differential (Michigan’s total 1stdowns minus opponent first downs) and also compare these to point differentials. I only did this for three seasons, but for that small sample, the R-value was 0.653, so although it is a weaker relationship, there is still a relationship here.
A LITTLE SUMMARY DATA:
First, here are the average differentials for each season studied and the average point differential:
|
YEAR |
AVG. 3RD DOWN DIFFERENTIAL |
AVG. POINT DIFFERENTIAL |
|
2005 |
5.53% |
8.42 |
|
2006 |
9.89% |
13.31 |
|
2007 |
8.38% |
5.85 |
|
2008 |
-11.43% |
-8.67 |
|
2009 |
3.45% |
2.00 |
|
2010 |
0.28% |
-2.46 |
|
2011 |
10.43% |
15.92 |
|
2012 |
16.90% |
10.00 |
For the entire sample of 101 games, the overall average differential for Michigan was 5.62% and the average point differential was 5.69. The standard deviations were 22.45% and 20.16 points respectively. Interestingly, the median value is 2.82% for the 3rddown differential and the median point differential is actually 4.00.
Second, here is a table which shows how many games in each of the eight seasons had a negative differential versus how many had a negative point differential. Actually, I left that in the table header because it is perhaps an excellent jargon term for a loss.
“We didn’t lose, but merely achieved a negative point differential.”
If only I had thought about this in 2008. Anyway, here’s the table:
|
SEASON |
GAMES WITH NEGATIVE 3rd DOWN DIFF. |
GAMES WITH NEGATIVE POINT DIFF. (LOSSES) |
|
2005 |
4 |
5 |
|
2006 |
4 |
2 |
|
2007 |
5 |
4 |
|
2008 |
10 |
9 |
|
2009 |
6 |
7 |
|
2010 |
7 |
6 |
|
2011 |
5 |
2 |
|
2012 |
3 |
5 |
The 2011 and 2012 numbers stood out to me, and in the last diary, someone pointed out the strange decoupling of differential and win percentage in this period for Michigan actually. In these tables, you can see just what that looked like. The average 3rddown differential went up from the previous year, but the average point differential fell. We only lost the battle of 3rddowns three times but lost five games. Indeed, in the 2011 season, we lost the battle of 3rddowns five times but only lost two games.
THIRD DOWN DIFFERENTIAL / POINT DIFFERENTIAL CHARTS:
FOR GIGGLES - FIRST DOWN DIFFERENTIAL / POINT DIFFERENTIAL (only for 2010-2012):
TL;DR CONCLUSION:
Essentially, this is testing the usefulness / limitations of this particular metric as a predictive tool, but doing so at the level of the games in the season and not just season averages. I like to think that it is reasonably useful if not always accurate.
OBLIGATORY:

August 14th, 2013 at 8:05 PM ^
I'm new to MGoblog and I must preface my replies with several things:
1) As a chemist, any correlation coefficiet under 0.96ish is unacceptable. Is this not the same for other sciences/statistical measures? (Chemistry holds precision to a high standard? BTW accuracy does not equal precision)
2) "For the entire sample of 101 games, the overall average differential for Michigan was 5.62% and the average point differential was 5.69. The standard deviations were 22.45% and 20.16 points respectively"
Um, what? I must be reading this worng. Please help me. (I will not be offended if I'm being a dumbass...please point out if true). There is no way in hell there was a standard deviation of 20.16 points in a season.... if so what do "points" mean in this context?
August 14th, 2013 at 9:02 PM ^
but in public policy terms even .6 is considered useful, and .96 is more or less completely unheard of. Don't ask me how that relates back to football or this diary, though.
August 14th, 2013 at 9:17 PM ^
In my own opinion, it's relatively difficult to get an R-value that high in metrics like this only because we're not discussing a lot of things which aren't measured typically, or sometimes it is simply not part of the study. As for the points, the deviation is for the differential itself and the sample is over 8 seasons, a few of which had some abnormal numbers across the board for Michigan football, so a high standard deviation should not shock anyone in that timeframe unless I am missing something.
August 15th, 2013 at 2:38 PM ^
Are always going to be lower. The statistical analysis of football games is pretty much a social science.
As a chemist, you typically have a well-defined analyte which can be detected using instrumentation based on well-understood physical principles. You also have well-understood techniques to separate the analyte from its substrate. You can also repeat it easily (as long as the money holds out, anyway).
In the social sciences, you have none of that. The relationship between any two variables may be complex or masked by numerous other variables, and designing your experiments to isolate variables is damn difficult. In many cases, you're stuck looking at statistics taken after the fact that may or may not even be a useful measurement. Your sample size may be small.
This is certainly true in football. You don't have any ability to experiment on the games themselvs, and you have to rely entirely on measurements taken during the game. Many of these are imperfect. For instance, in NCAA games sack yardage is lumped in with rushing yards. The sample size is also relatively small.
August 15th, 2013 at 7:03 PM ^
Thank you. I was not sure if I would get flamed for my comment. Never forget, if the name of the discipline has 'science' in it, it is not actually a science. Physics, biology, chemistry vs. Social sciences = not the same thing. Humans are too complicated. A team full of 50+ humans = way too complicated for a strict analysis.
August 15th, 2013 at 9:57 PM ^
Ah, the ignorance of youth! The claim that something isn't a science because it is imprecise is the claim of someone who doesn't know what a science is. Because the School of Literature, Science, and the Arts has "science" in the name doesn't mean that it doesn't actually have science. There is no "discipline" called "social science," so that argument falls of its own weight anyway.
The various social sciences are science in that they use the scientific method, insofar as that method can be applied. They are imprecise, because, as you note, "humans are too complicated." Even more, though, they are imprecise because of the general consensus that experimentation on human behavior is unethical.
So, feel free to feel all superior because chemistry is much more precise than any of the social sciences. I'd feel a lot worse taking my meds if it were not. However, you might want to check out what the socila sciences are actually about before parading your ignorance with such statements as "[n]ever forget, if the name of the discipline has 'science' in it, it is not actually a science."
I have worked in the field of physics and that of economics, and can attest to both the use of the scientific method and the levels of precision.
Go Blue!
August 15th, 2013 at 11:49 PM ^
Wow! Assuming much? "The ignorance of youth!" Because my statement upsets you I am automatically youth? I love you cutting me off at the knees at the start of your comment with nonsensical statements that contains no evidence.
Certainly, science is a process, not a statement of facts. To sum it up, science is a verb. It is what a person "does" rather than what a person "knows." What I was trying to get at, from my origininal post is , " What is the threshold of acceptable limitations for analysis?"
....and I would actually like to know what the acceptable limits are in diferrent fields, because I honestly do not know. If you can't handle this, that is your problem. In this regard football is not equal to chemistry which is not equal to sociology, which is not equal to any 'social science.' "What r-squared value is acceptable in different fields?" I would like to know.
[Also, I love riling up social scientists, because it is so easy. Additonally I am still upset that they managed to finagle TA benfits away from me and towards themselves (from an unnamed Big Ten University) despite the fact that the students in my own major brought in tens of millions of more research dollars per year than other majors.]
Surely one can attempt to apply the scientific method to any question. But at what point does it become unfruitful? Let me know when the field of economics has produced a theory or law that can accurately predict the future. (We will make $billions!) Chemistry has done this already. Has economics? [To your benefit, physics has done this many times over]
I will continue to feel superior. Mostly because I am a cocky, elitsit, educated bastard and I am a member of the UM community, so thank you for your acceptance.
August 16th, 2013 at 9:35 AM ^
August 16th, 2013 at 9:07 AM ^
or just a b-hole
for someone 'new to mgoblog' you sure come out swinging. but as far as your original question goes, the OP gave the actual R^2 value so you could make your own conclusions. you can dismiss it since it is below your chemistry standards of .96 or you can understand the amount of noise in the sampling and take it for what it's worth
[edit: sorry that was meant to be in reply to the previous commentor]

Comments