Independence on the 4th (Down)
Two years ago I piled onto the idea that coaches don’t maximize on fourth down. Or at least they don’t maximize to scoring the most points. More likely, they minimize the chance of getting fired for making a risky decision.
Within the post I noted that coaches are too conservative and presented an initial treatment to what the decision matrix should look like. I also identified several of the key objections to the “Stop Punting” movement. Over the last two years I have accumulated more data, thought about the topic further and think there is more to add to the conversation. The general conclusion is the same but I have added some new tools that should shed some new light on the subject and bring some power to the people.
A quick review of the main objections:
4th Down stops don’t account for momentum change
I still haven’t found that this has a quantitative impact to anything. Last month I found that teams go for big passing plays more often but that they don’t actually score any more points.
Assumes all offenses and defenses are average
This is a big one. Two years ago I gave this a surface review but will go into more detail below.
Doesn’t account for in-game situations
It’s a valid critique but one that is rarely applicable and easily approximated. With more than 2 possessions left and a competitive game means expected points are directly correlated with win likelihood. A close game late or a blowout will usually point you where you need to go with common sense. In game situations matter, just less than you think they do.
All Men Offenses, Defenses and Kickers are Not Created Equal
This is the big adjustment. Rather than looking at the very best and how their expected value differ from average as I did last time, I made the tool dynamic. I can now look at how each situation changes when you have a dominant offense, or if your defense is a sieve. It can also account for kicker quality. A really good or really bad kicker definitely changes the mindset. Announcers generally frame the decision as “you have to take the three points” even though the odds of success are significantly less than 100%. A great kicker will push the decision closer to that thinking for a quarter of the field. Likewise a terrible kicker takes the field goal out of play for a large portion of the situations.
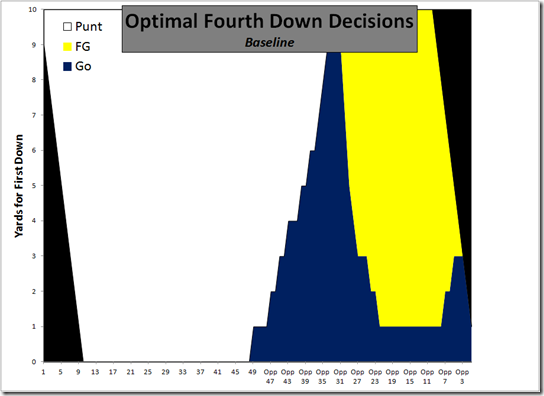
So to see how different strengths and weaknesses affect the outcomes lets start with the updated baseline chart:
Maximum “go” territory is around the Opponent’s 32 yard line where even on 4th and 10 going for it might be the best play. Once you hit the 20 yard line the field goal is the best option unless you only have one yard to go. This stays true until you get inside the 10, then the opportunity for 3 yards or less becomes more optimal.
So what happens when you get a large variance in teams’ offense and defense. A great example would be the infamous Michigan 2010 team. The offense was as great as the defense and kicking game were terrible. Plugging in extreme values for all three dramatically changes the decision matrix.
Michigan 2010 should have gone for it early and often. Field goals should not have been attempted of 40 yards or more and if the yards to go were 6 or less the offense should have always stayed on the field.
Michigan 2011 was a dramatically different team from 2010. The offense was still good, but not as great as 2010. The defense stopped being a tire fire and the kicking game was much more reliable. I adjusted the offense down a bit and the defense up considerably and moving kicking to average.
The end result is a chart that is somewhere between the baseline and the Michigan 2010. Field goals become the best option when the distance to go is greater but aggressiveness when crossing the 40 is still warranted.
Life, Liberty and the Pursuit of Proper 4th Down Strategy
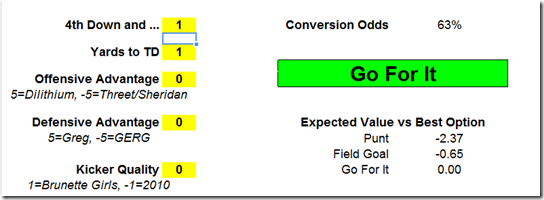
As part of this work, I have built a public Google Spreadsheet that you at home can use to overanalyze your favorite 4th down situation, complete with dynamic skill ranges.
Each situation adjusts the 4th down conversion chances and upside and downside of any decision. It outputs what the best decision would be and how many expected points you would be leaving on the table with the “wrong” choice.
The offensive and defensive ratings go from +5 to -5 with 0 being average. They are a measure of the difference between the offense and the defense. Michigan’s offense should be a +5 against Minnesota but probably a -2 against Alabama. The rating affects both the odds of conversion and the value of the resulting 1st down if successful. Defense is the same in that it is a measure of the difference between your defense and the opponent offense. Adjusting the defensive metric affects the value of a resulting possession change whether by missed FG, punt or missed fourth down conversion.
I hope you enjoy looking at this and I included some special Easter Eggs for the curious.
"Is your coach Ron Zook" Brilliant
Great stuff as always, Mathlete. This is a step towards debunking some of the arguments against aggressive 4th down play. No amount of data will overcome the "getting fired" concern from coaches or placate the rage of an average fan when a critical 4th down attempt fails, but any coach that has confidence that the numbers mean something should be able to keep a cool head when it doesn't work out- much like a good poker player can avoid going on tilt after a bad beat. Not a perfect comparison by any means, but In both games you have to balance the statistical and the psychological.
As for the easter eggs, I didn't have the patience to search but took a look at cells with formulas... very cheeky.
Great work! This is really interesting.
One question - if the offense and defense are rated relative to each other, doesn't that mean that (Offensive Advantage) = - (Defensive Advantage)? This isn't too important, but I was curious if there was a subtlety I was missing.
Also, I love the Easter eggs!
Off Adv = Your Off- Their Def
Def Adv = Your Def - Their Off
I wonder if coaches in the pressbox (like Borges) could actually plug game data into such a program and let the computer decide the optimal decision based off of past statistics. It would certiainly be an interesting result for college football.....computerized coaches!!
This is the coolest thing of all time.
Just wanted to state I believe in your data and your way of thinking. Just wanted to see if you thought my contrarian thought to your data holds water from a statistical perspective.
I think for NFL teams and 90% of college teams following your chart religously would be beneficial over the long run but I was wondering if for Top 10 teams following your chart religously would expose them to a greater chance of a loss and therefore not be the way to go. My thinking is that over the course of a season you would have a game where you had an unsuccesful stretch on 4th down and possibly cost you the game.
The goal of a top 10 team is not to score the most points or give you the best chance of winning 10 games it is to not lose a game. Introducing more variance I think increases the chances you lose a game. My example would be let's say that Ala, Flo, LSU and Aub are all pretty much equal but LSU is just a little bit better and they won all 3 games by a total of 20pts. If LSU uses your chart in every game they would increase their pt potential and their point differntial might go up to 40pts to the positive in the 3 games but they also open up the chance that in 1 of those games they might lose it when things go bad.
I'm not sure if I'm explaining myself well here, but I'd love to hear your thoughts.
I almost agree with your reasoning. In general, risk tradeoffs are easier for those attempting to rise than those already at the top. A failed fourth down attempt could certainly cost a top team a game and that game could cost them a shot at a championship. The point is that the strategy is more likely to win them a game than lose one. The risk is there and thats why this is an outsider strategy and not the norm. A more aggressive strategy does open up more risks but the point is that it opens up even more opportunities, no matter where your team falls in the rankings.
I'm surprised that kicking the FG was ever the optimal decision in 2010. Seriously, what were we, 4-15 on the year? We were so unreliable - and it seemed to not even matter where we were when we kicked it - that we might have been better off literally never kicking a FG that year.
The Go/Punt/Field Goal decisions Hoke made this year and where they fall on the chart.


Comments