How valuable are returning starters and what positions are they most valuable at

Submitted by The Mathlete on

Just finished cleaning up my database for the 2009 football season and got 2008 added as well.  Hopefully will have the other 5 years or so of play by play data that the NCAA's website posts added to my database before football season starts, but its mindless data entry and I can only handle so much at a time! 

For now I wanted to compare 2008 vs 2009 and see how valuable it was to have returning starters and what positions it mattered the most at.  To this I used my opp adjusted team values (explanation here) from 2008 and 2009 as well as the handy Phil Steele Returning Starts* by position by team. To make the data manageable, I grouped the 120 FCS teams into deciles of 12 teams each, and used them as a composite group.  The least experienced teams would be decile 1 and the most experienced would 10.  I then looked at how much the returning starts meant for both outright success and improvement vs prior year as measured in points/game.

*I used returning starts as opposed to starters because there is a little more depth and separation to the numbers then.  7 returning starters could be 50 returning starts or it could 150 depending on how long some of the players had been starting.

Quarterback

Bottom two deciles = death!

Teams in the bottom two deciles, on average, were 4.1 points per game (3 points per game = about 1 win over the course of a season) worse in 2009 than they were in 2008.  In essence, this was Michigan 2009.  Technically, Michigan fell into D3 thanks to the valuable returning starts of Nick Sheridan.  Michigan's 8.4 pts/game offensive improvement was 2nd best nationally of any team returning less than 10 starts at quarterback. 

Overall, the impact of a returning QB starts goes beyond the passing game.  Each decile of experience is worth about a quarter of a point per game passing, but about a third of a point a game per decile on total offense.  Moving 5 deciles in experience is worth about a 1.5 a game for the offense.

Running Back

No position on the field came close to running backs in terms of lack of value for returning starts. 

There was literally no correlation from returning starts from running backs to on field success.  No improvements in running game or total offensive output. 

Michigan certainly has some questions at running back going into this season, but there is nothing in the numbers from 2008-2009 that says that bringing in an untested face at running back is a red flag.

Wide Receiver

This was the position that shocked me.  I always considered the wide receiver position to be largely talent driven with little thought given to the value of experience for receivers. 

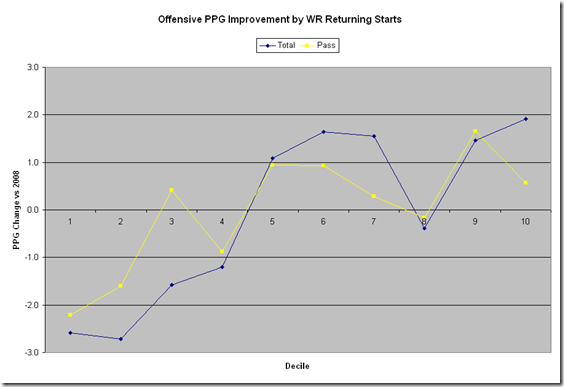
In one of the strongest correlations I found, each decile of returning wide receiver experience was worth a half a point per game improvement.  Even more surprising, the improvement wasn't restricted to the passing game.  Of the half point improvement, only .3 ppg could be attributed to the passing game.  Veteran wide receivers play a huge role in a team's progress.  This may have been a fluky correlation for 2008-2009 but within the data set, it had one of the highest R squared values I found at 0.72.
image

Offensive Line

This was one of the hot theories going into last year, even sparking a Wall Street Journal article singing its praises.  The hidden secret to success was returning offensive line starts. 

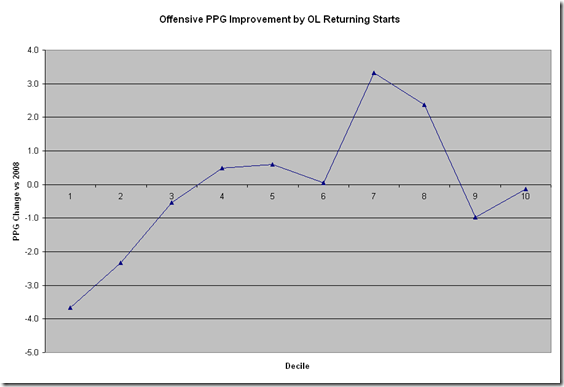
What did I find, not that much.  I found that like quarterbacks, if you are in the bottom 20% of returning starters, your offense is in trouble, but beyond that, there wasn't much fire to the smoke.  Among the top 8 deciles, there was almost no correlation between returning OL starts and offensive success.  In fact, the top 20% of teams in returning starts were on average worse offensively in 2009 than in 2008.
image

Offense Overall

After breaking down the position groups, I took a look at the offensive unit in total.  There were two interesting trends that popped out in the aggregate look:

1. Either you are in or you are out, there is no in between.  The top 50% was 2 ppg game better than the previous season, whether they were in the 6th or 10th decile.  The bottom 50% was 2 ppg worse than 2008, whether they were 5th decile or 1st.

image

2. Overall returning starts plays a huge role in the running game. Even though running back returning starts didn't matter much, the totality of the offensive's returning starts had a third of a ppg per decile correlation with a 0.92! R squared value, the highest of any metric I looked at.

image

Defense Overall

Defense is a bit more of a fluid group, so although I looked at them individually, it seemed best to talk about them together.  Returning starts from the defense in total were much more valuable than returning starts from any single position group.  And like the offense, the biggest observation about the defense is that you don't want to be at the bottom of the food chain when it comes to returning starts.  The teams with the fewest returning starts were again, 5 points worse per game than even team in the bottom third. 

By position groups, the values were not as strong by position group as they were on offense.  There was also more intuitive results on the defensive side, DL starts were most valuable against the run, DB starts most valuable against the pass and LB in between on both.

image

Team Overall

Returning starts don't matter as much as people think.  The way they are most likely to affect a team is if you have very few.  A whole host of returners isn't necessarily more valuable than a solid group.  Just don't be stuck at the bottom, even a low ranking in a single position group can be worth a game or two. 

In the big picture, there is no difference between the 2nd decile and the 8th decile.  The 1st decile (last year anything less than 200 returning starts) was an unmitigated disaster, with only 3 of the bottom 12 improving at all and 4 of 12 showing double digit declines.  On the top end, the 9th and 10th decile were the only groups to show separation from the pack, but nothing like the separation at the bottom.

Side Note on turnovers

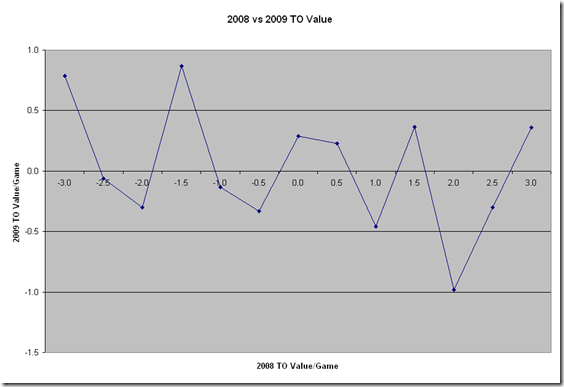
This topic has been covered very well on this site previously, so no need to add much more to it than to agree and say, turnovers are random!  Both forcing them and committing them shows virtually zero correlation from one year to the next.  If anything there is a slight negative correlation between turnovers one year to the next.
image

Future Articles

Now that I have 2008 loaded, if there is anything anyone out there would like to see, please let me know.  I have a couple of ideas loaded up.  I now have player positions loaded for 2009 and can therefor compare the seasons of BG, Suh and anyone else to see how they stacked up to their positional peers and how good their seasons really were.  I am also planning a post on the luckiest and unluckiest teams of 2009.  Let me know what you want to see and I will put a diary or forum post with what I can.

Comments

Captain

March 29th, 2010 at 6:07 PM ^

Thanks for the diary. I now have a better idea about how important returning starts are for various position groups, and I also have a good idea how many returning starts Michigan has for each position group. What I don't really know is how Michigan's returning starts compare with those of other teams. In other words, what decile did Michigan fall into for these categories in 2008, 2009, and 2010? Tate obviously has some starts under his belt - does that move us from the 1st decile to the 6th? Any insight would be helpful! **translation** Please tell me that this data demonstrates that we are now made of adamantium and miracles.

Michigan Arrogance

March 29th, 2010 at 6:13 PM ^

Wide Receiver This was the position that shocked me. I always considered the wide receiver position to be largely talent driven with little thought given to the value of experience for receivers.
I always had the same feeling, ie: how much can a WR really affect the offese, since they are on the "receiving" (pun) end of the operation. all they do is catch the ball and try to get open. but, after reading more & more about the intricacies of modern offense, passing game especially... WRs are a huge part of what makes a QB and thus an offense successful.

Kilgore Trout

March 29th, 2010 at 11:02 PM ^

So after all of our worrying and anguish about OL and QB losses in '08, maybe we should have really been concerned about the loss of Arington and Manningham. Who knew? When you think about it though, it does make some sense. The threat of a big play WR opens up room for the running game and takes pressure off the QB. Good blocking WRs also make a big, but underappreciated contribution to the running game. I have to imagine things would have been different if Rodriguez had a WR corps of Manningham, Arington, and Mathews in '08. Maybe he goes exclusively with Threet at the beginning of the season and goes with a more pro-style offense (since his given reason for not phasing in the spread is that there was no experience anywhere so they might as well start fresh) and the disaster of '08 is not as horrible.

The Mathlete

March 29th, 2010 at 7:16 PM ^

Just data for 2009 season: 21 new coaches, average team taken over had 251 returning starts vs. 272 for returning coaches. Best turnarounds: Miss St: +15.1 D3 Washington: +15.0 D9 SDSU: +11.6 D6 Auburn: +10.4 D4 Tennessee: +9.4 D6 Biggest dropoffs: Ball St: -21.3 D2 New Mexico: -17.1 D1 Army: -9.9 D1 Bowling Green: -8.7 D2 Eastern Mich: -8.6 D10 Hard to glean a lot from this. Brady Hoke is probably a pretty good coach if his new team went +11.6 and his old team went -21.3. Ron English had a rough start as a roster full of returners was 8.6 points worse this year. The four biggest dropoffs were all teams in the dreaded bottom 20%.

MGoData

March 29th, 2010 at 6:31 PM ^

What data specifically are you grabbing from the NCAA site? I just wrote a small web crawler that is going through and downloading rosters and team stats for every Div 1 team off of ESPN.com. I am sure it wouldn't be that hard to modify to grab data from the NCAA site. No need to enter by hand.

The Mathlete

March 29th, 2010 at 6:47 PM ^

Not doing it directly by hand. I go to the NCAA website and pull down the play by play page for each game, copy it over to an excel document that "translates" the text into appropriate fields I have designated and then copy that data over to an Access DB that hosts all of the games. Most games only take about 15-20 seconds to do, but a small but real percent of them have errors that I have flagged and must correct manually. The time for each isn't large, but 120 teams, 12 games per season takes a while to get through. If you think you can help me out I would be more than willing to take you up.

mgopat

March 29th, 2010 at 6:45 PM ^

This is great information -- is there any way that you can include a chart or graph in the future, so that we have an easy way to digest this at a glance? That data could be extremely valuable, and not just to our little internet community.

MCalibur

March 29th, 2010 at 8:26 PM ^

Save your graphs as .png or .jpg files and you can load directly onto picassa and get urls for the pics. I think if you save them as 560 pixels wide, they'll fit exactly into the main frame of the site. Also, Brian has a good note under "Useful Stuff" on how to configure Window Live Writer to edit and post Diaries. I've done that and its easy to set up and really helpful. Makes it way easier to do diaries that look good on the first shot.

The Mathlete

March 30th, 2010 at 11:56 AM ^

I guess I hit the magic threshold on points and am now able to post via Live Writer which is revolutionary as compared with the web interface. I reposted with a handful of charts that should help and you will see much more of this support on future posts.

MGrad

March 29th, 2010 at 6:48 PM ^

I still think that the strength of schedule (broadly) or strength of opponent (more specifically) should somehow apply either a positive or negative weight to the points calculation when looking at team performance. I get a little concerned about averages when considering Michigan's 2009 offensive output, knowing that the team hung 31 on Western, 38 on Eastern and 63 on Delaware State.

tjyoung

March 29th, 2010 at 6:57 PM ^

I think you have to make the assumption that all teams have the same type of schedule (cupcakes vs. tough games). I don't know for sure, but don't most other teams schedule cupcakes? And most other teams schedule tough games as well. Thus, with that logic, strength of schedule isn't a huge factor. (It is, of course, a factor. Just IME not a huge one.)

The Mathlete

March 29th, 2010 at 7:08 PM ^

If you click on the overview of how I calculate things you'll see that all numbers are adjusted for strength of opponent (since everything is done on a per down basis) so strength of schedule is factored in. Also, only games vs FBS competition are included, no Delaware St's for anyone.

MGrad

March 29th, 2010 at 8:14 PM ^

I did read the calculator explanation, but I suspect I am missing something. Keying in on one team as as example, like Western, might help. They were sort of a "middle of the road" team against most of their competition outside of Michigan and MSU. Would your statistical averaging elevate them to a net "average" opponent offensively or defensively, or would they be considered below average in the big picture (i.e. if the stats crunch correctly, I wouldn't expect them to compare favorably to many, or possibly any, B10 opponent). In the final FBS rankings at SI, for example, Western is in the lower third of their final 2009 ranking, fwiw.

The Mathlete

March 29th, 2010 at 10:25 PM ^

The SOS works like this. You take all of Western Michigan's games and you see how much Michigan fared vs WMU as compared with the other 11 teams. Western was a -9 last year, 7th in the MAC and 95th nationally, so a lot of teams had success against Western Michigan. That success is then the baseline. If Michigan had a +9 game against WMU, after adjustment that game would become a 0, because their performance, although good, was only average given the competition. Likewise a +15 performance would be downgraded to a +6 or a +1 performance would become a -8. Hope this helps.

MCalibur

March 29th, 2010 at 7:23 PM ^

A couple of point of contention though: 1) I don't know how valid it is to split the data into straight deciles. This may be why there isn't much separation between groups. Might it be better to split by a strict bin rang (i.e. Grp1= 0 - 199 Starts, Grp 200-399 starts, and so on)? The N=value per bin will change but you can compensate with error bars or t-test (or whatever). I mean, once you're in geek land you might as well go all the way; no offense. 2) I also balk at the idea of using total returning starts as the critical variable. For example, if an offense had all 11 starters on offense from the previous season, and each start all 16 games but none of them had ever started before, the unit would have 176 starts. Conversely, If you had 3 four year starters (Henne, Hart, Long) and a bunch of true freshmen you could rack up the same number of returning starts, even more, with WAY less overall experience. My point is that distribution of returning experience matters more than total amount of experience. I think if you use a harmonic mean of returning starts then plotted points (or whatever) vs. that value, there would probably be better clarity in the results; though how you bin the data probably still matters. Again, not trying to out geek you, just really interested in the results and I know they're in there somewhere. Finally, I have a play-by-play cotton gin I, uh, ginned up in visual basic that I think does what you're doing here, but I'll bet my pocket protector that yours is more sophisticated than mine. Bottom line, if you want a hand mining the data, I'd be happy to lend a hand. [email protected]

MCalibur

March 30th, 2010 at 11:08 PM ^

The harmonic mean is the reciprocal of the average of the reciprocals ( I have no idea where the name comes from). For what Mathlete is trying to accomplish I think this makes more football sense than your standard average. Even though its typically used to average ratios (i.e price-to-earnings, miles per hour, and so on) I think it has special relevance in this instance. That math trick has the effect of diminishing the importance of large numbers while amplifying the significance of lower numbers. We have all heard-- I think most would agree--that a player improves most between year 1 and year 2. That also implies that the first year of starting is more educational than the last year of starting. The Mathlete's method needs to be modified if you agree with that idea because the cumulative returning starts metric treats all starts as being of equal value then allows inexperienced players to benefit from the experience of others, which I don't think is appropriate. In the example I mention above (though I botched it because I used an NFL season instead of an NCAA season) an offense that has 11 first year starters returning with 12 games of experience (cum. A = 132) has much more overall experience than a team with 3 starters having 41 starts each and the other 8 having 1 start each (cum. B = 131). The harmonic mean for A is 12, whereas the harmonic mean for B is about 1.4. I'm not sure doing this would add any resolution to the conclusions, just think it might be worth a shot. Regardless,I think some sort of distinction between team A and B is appropriate for the reasoning stated above.

mi93

March 29th, 2010 at 7:51 PM ^

not just starts, but class? Is there anyway to take a look at class distribution as well? How many starters are seniors, etc.?

colin

March 29th, 2010 at 8:28 PM ^

So this would be evidence in favor of the chaining theory of football success, right? I.e. Incremental gains where very few positions are ultimately more or less important than any other. Also, to reiterate an above poster, I would be interested in seeing the impact of age regardless of experience. Baseball analysis is very much keyed on age (though Im not exactly clear whether or not that is a proxy for experience...) and the work done suggests that there are serious gains made year to year from 18-22 in particular.

colin

March 30th, 2010 at 5:37 PM ^

if 3 ppg = 1 win, then Nick Sheridan was as bad as I thought in 2008, but I only looked at pass plays http://spreadsheets.google.com/pub?key=py8szOdT08yd9kVHGi2VwSw if you convert points per pass play to points per game (say by multiplying by 35 pass plays), that's -2 wins above average or so. but if you consider, like the evidence suggests, that there is some significant points lost at QB on running plays as well, then it might be the case that the deathtrap at QB was almost entirely responsible for the fact that M was well below average in '08.

The Mathlete

March 30th, 2010 at 6:57 PM ^

Michigan's 2008 passing game was 6th worst in the country at -6.8 ppg, only Colorado and Washington State where worse for BCS schools. That number improved to -.5 for 2009, good for a 2 game improvement.

Starko

March 30th, 2010 at 7:21 PM ^

Shouldn't you also account for how many returning starters the same team had in 2008? Two teams having the same number of returning starters in 2009 are being compared to their respective success in 2008, but they may have had different numbers of returning starters in that year, no? I'm probably misunderstanding, but if you could clarify that, it would be appreciated.

colin

March 30th, 2010 at 7:32 PM ^

could post your database? I know that might be asking a lot depending on your aims, but it would be an invaluable resource for anyone with the expertise.

The Mathlete

April 1st, 2010 at 12:28 PM ^

Brian and I exchanged an email or two on the idea of making it accessible but at this point we haven't really gotten anywhere with it. Trying to pull the remaining couple years of PBP data that's available from the NCAA to fill out the database, then figure out what to do with all the data I will have then.

bjk

April 1st, 2010 at 3:27 PM ^

the grunt work of getting the (five years of) raw data entered, which you alluded to above, by somehow posting the raw data and the entry forms here? So you can spend your time and energy on the creative aspects? Edit: Didn't see MCalibur below. I bet there are at least a few folks here willing to help out, if there were a way to sign up.

Zone Left

March 30th, 2010 at 7:33 PM ^

I think this analysis demonstrates just how far the team had to come over the past two years. Both teams essentially returned zero quarterback starts, and very few starts anywhere else on offense. Nick Sheridan doesn't really count is real terms, because he wasn't going to play except in an apocalyptic scenario. Just tricking the team to 8 wins over the past couple of years, especially when a lack of scholarship players is factored in, makes the coaching job seem that much better.

bjk

April 1st, 2010 at 3:22 PM ^

that conventional wisdom would expect that a coach who really gets the most out of whatever it is he has would have managed a win or two more per season over the last two years. Of course, we hope for more of an up side over the longer haul to offset the difficult start.