Home-Field Advantage, what is it worth?
[Ed.: Instead of throwing my internet connection through a window I'm going to bump this Mathlete post. Thank you for your UFR-related patience. Also argh.]
In honor of Michigan’s final home game of the 2010 season, I decided to look a little deeper at the true value that home field holds.
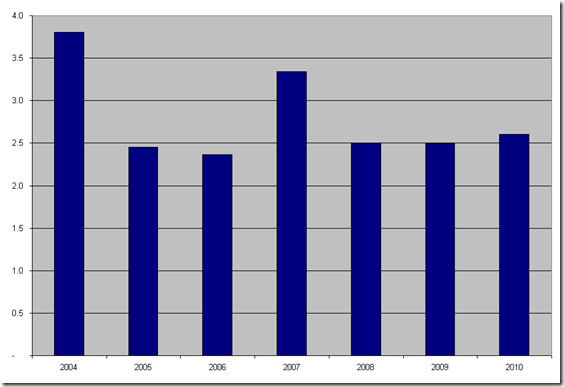
The generally accepted value is that home field is worth about 3 points. Over the last 7 years that value has held fairly true. The average from 2004 to 2010 has been a 2.8 point per game advantage for the home team. 2004 and 2007 were big years for the home teams, with the home teams holding a 3.5 points per game advantage whereas in all other years the number was closer to 2.5 points per game.*
*All point references in this article are based on my PAN metric and are opponent adjusted, exclude games against FCS opponents and exclude garbage time situations.
Home field advantage is one of those things it is very difficult to pin point from game to game but it’s effects are very present over the broader scope. That isn’t to say however that there aren’t differences between how the effect plays out for different teams or even conferences.
Big House Advantage
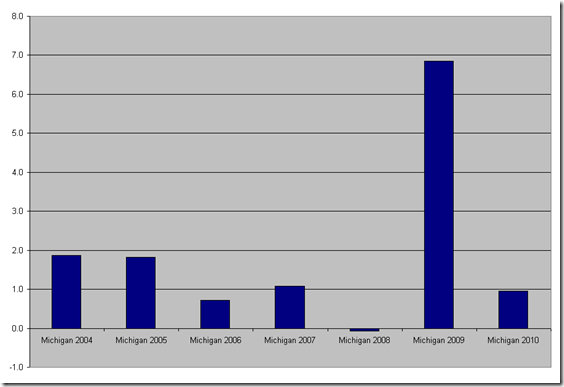
Last year saw the Wolverines have their biggest disparity between home and road performance at nearly a touchdown per game. Most of the last several years have been between 1 and 2 points per game, less than the national average.
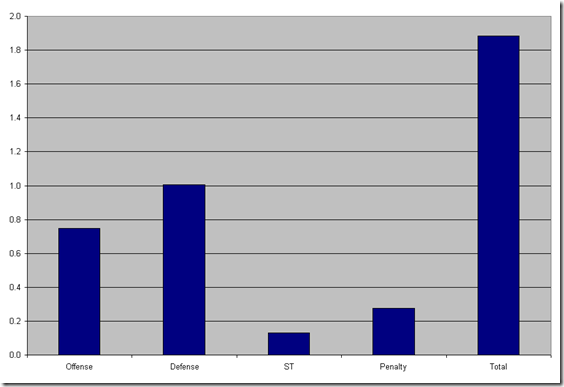
Michigan has seen more advantage come from the defense than the offense.
Although the overall level of home field advantage has been lower at Michigan than other places, the general splits are roughly in line. Teams tend to get a slightly bigger advantage from the defense than the offense and Michigan is near the middle of the pack in special teams and penalty disparity.
Conference Advantages
From 2004 to 2010 the WAC and Conf USA teams saw the biggest difference between the performance at home and the performance on the road. The Big East, MAC and even the liquored up SEC fans saw the lowest difference between home and road results, all coming in at less than 2 points per game over the last seven years.
For individual teams, home field has meant big things for some teams and been a disadvantage for a few. The lures of Hawaii and Las Vegas are perhaps too much for opponents as the Warriors and the Rebels lead the nation in home field advantage at more than double the national average. Bob Stoops at Oklahoma has come under fire for his road performance and rightfully so. This year the Sooners are fourth in home/road splits and they are third over the last seven years.
In The Big Ten
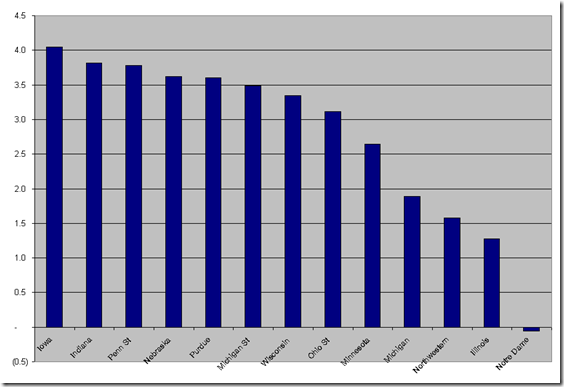
Since home field advantage isn’t necessarily about how well teams play at home but about how much better a team plays at home versus on the road, sometimes some unlikely teams pop to the top of the list. Iowa tops the list at over 4 points per game but Indiana and Purdue are in the top half of the spread. Michigan is one of the lowest in the Big Ten at less than 2 points per game. South Bend certainly wasn’t a decided locational advantage - the Fighting Irish are one of only five teams to average better performances on the road than at home over the last seven years.
What does it all mean
There is obviously an advantage to playing at home that affects all facets of the game. It is very difficult to pinpoint where the advantage is in any specific game but over a large set of games the advantages really start to show. Even though only five teams were worse at home than on the road over the last seven years, 102 out of 120 teams had at least one season where their road scores were higher than their home scores.
November 18th, 2010 at 10:09 AM ^
but I'm pretty happy that we are almost just as good on the road as at home. There's something to be said for consistency.
I would like to see us jump up in the rankings though. I also wonder if that will increase due to the stadium renovations. If they will feed off of the increased noise and the atmosphere.
November 18th, 2010 at 10:50 AM ^
on saturday, let's be loud and cause a dramatic shift in michigan's homefield advantage. let's force the mathlete to do another diary.
November 18th, 2010 at 10:56 AM ^
Maybe those pink locker rooms at Iowa really do help.
November 18th, 2010 at 11:06 AM ^
Hi Mathlete, great work as always.
When you look at conferences -- are you looking only at in-conference games? I ask because it would seem to me that most BCS AQ-type conferences will win their (largely home) nonconference games. How much are the cupcake games, esp. vs. I-AA, exaggerating the home-road spread?
November 18th, 2010 at 11:25 AM ^
1AA games are completely excluded and not considered. All other games are adjusted for strength of opponent so its not just an effect of teams loading up on cupcakes at home and having to play real games on the road. The Non-AQ thing jumped out at me but the MAC is one of the lowest teams. The other idea I had was that it might be more about travel distance. The non-AQ conferences, other than the MAC and Sun Belt have wider footprints where most of the AQ conferences have more concise footprints. Certainly not the end all answer, but without digging in deep, seems like it could be a major contributor.
November 18th, 2010 at 11:08 AM ^
(for most teams), but I think that it is very difficult to measure the amount due to so many variables. The best test sample would likely come from the NBA or MLB where teams play multiple games against the same teams both home and away in the same season.
November 18th, 2010 at 11:36 AM ^
The MLB is kind of a special case, though, because the rules give the home team an advantage (batting last) in all games, and an even bigger advantage (DH or not DH) in inter-league games.
November 18th, 2010 at 6:34 PM ^
unlike in other sports, meaning you can add to your HFA if you build your club accordingly.
That's unfortunate, because MLB provides the greatest amount of data per season ...
November 18th, 2010 at 11:33 AM ^
The key to home field advantage, I had always heard, seems to generally be, "how long does it take the visiting team to travel to the home team's stadium?" It has much less to do with "how loud is the home team's stadium?"
The fact that the WAC, CUSA and MWC have the highest HFA seems to support this theory.
November 18th, 2010 at 11:37 AM ^
Defenses get more of a boost. Yep, believe that since one of the defining characteristics of a "home" crowd is that they cheer for you louder than they do for the other teams, but when your team is on offense, you generally as a fan stay quiter to allow the offense to operate where as on defense your yelling gets more pronounced as you try to "disrupt" the opponents offense.
Additionally, the travel thing makes a LOT of sense. your'e talking abotu 18-22 yr olds, many of who b/c of poor living conditions in poorer communities going on things like planes for the first time or having to adjust to different time zones. I bet if you were able to put a PAN adjustment for time zone delta, this would be more pronounced.
November 18th, 2010 at 11:43 AM ^
November 18th, 2010 at 11:59 AM ^
Mathlete,
What do you do for a living? I am wondering where you developed your mathematical skills.
November 18th, 2010 at 12:14 PM ^
Mathlete is Lloyd Brady. So a supermodel is what he does.
November 18th, 2010 at 12:24 PM ^
is thrown WAY off by the Minnesota performance.
November 18th, 2010 at 1:23 PM ^
I'm down in Texas and I was wondering if there was anyway to get the breakdown of the guys in the Big 12 (or maybe each BCS conference) if that's not too much trouble!
Thanks!
November 18th, 2010 at 2:05 PM ^
Great stuff! I'd be interested in knowing what sorts of variances (error bars) we are talking about . I'm not sure how the data is put together, so I don't know over what the variances can be measured, but perhaps they can be based on season-to-season changes. I'm mostly interested in seeing what is significant difference between conferences and teams.
November 18th, 2010 at 2:49 PM ^
An awesome chart, IMHO, is a chart that makes you think of other questions. So here are some mine:
1) How can we distinguish between the home-field advantage of a given team and its on-the-road-suckitude? "We do better a home than on the road" could have either or both causes. Could be "the opposing team does worse than expected" as well. How to tell which is contributing the most to the 2-3 points you've discovered?
2) First I was thinking that we could work out how many games in a season a 2.5 point home field advantage would result in. But doh that's easy - on average, across all teams, there is no effect of the basic home field advantage on winning, because half of all games are on the road so win some lose some (*asterisk added for those who will otherwise fuss about the small number of neutral-site games.)
So, the real REAL home field advantage is if there is a BIGGER home field advantage "chez us" than the average home field. (like, perhaps, the perception that Happy Valley is particular hard on visitors.)
Looking at the range of home-field advantage calculations you've come up with (way cool), I'm still wondering if it's even possible to document a statistically significant advantage of any given team's home field vs. the average home field advantage (one that could not be driven by random variation).
Whaddaya think?
November 18th, 2010 at 3:15 PM ^
the fact that the title reminded me of, "Magents?!? How do they work?"
November 18th, 2010 at 4:32 PM ^
Don't major programs tend to schedule weaker teams for their non-conference games? Look at Michigan, scheduling Eastern, Western, BGSU, etc. These are dvision I-A teams, but they're still cupcakes. I think most big-six teams schedule their non-conference like this. This can definitely skew results a bit.
November 18th, 2010 at 5:07 PM ^
For example, Indiana loses pretty much all of its away B10 games, and just about all of its home B10 games. But the last 5 years they've generally scheduled an awful preseason in an effort to get bowl eligible.
On the other hand, I think the Mathlete's model corrects for cupcakes - it's how much you beat them by in different game facets that counts, not whether you actually win. Otherwise the SEC would be at the top of the list with the way they schedule.
This works for Indiana too. They often roll over and die in away games, to the point that those of us that sort of follow the Hoosiers wonder if the coach simply crosses some off the list and treats them as glorified practices, while focusing the team's efforts on home games. The Wisconsin game comes to mind, though they lost Chappel before things really got ugly.
November 18th, 2010 at 7:02 PM ^
that penalties dont account for much advantage. I assume you went by penalty yardage, but I wonder if penalties would account for more if one could quantify game-changing penalties vs run of the mill penalties. For example, a holding on first down is less impacting than a holding on third down. A pass interference penalty on first or second down is yardage, but on third or fourth down it is drive extending. Garbage time penalties probably favor the losing team, as some of the studies on referee bias have shown in other sports, and you may have accounted for garbage time. Also blatant no calls can have just as much impact as penalties, so I would suggest the overall effect of refereeing would probably be doubled.
Not suggesting that it would be feasible to account for all that, just some thoughts. Appreciate your work, Mathlete!


Comments