Blue Moon in My Eye

Those that know me for realz know that, these days, it won’t be too long before a generic conversation with me turns to Michigan Football or Jay Z; especially if that conversation has been libated. It’s a fairly recent phenomenon, too. Say, oh I don’t know, 960 days or so. Or maybe it’s been 1248 days…Anyway, I used to be obliviously secure in knowing that, no matter what, Michigan would be fine: we’d win a bunch of games and go to a good bowl. Disappointed as I might be that we were usually out of the National Championship picture by the middle of October or, as was way too often the case, the second week in September—ahem—I could always say: “Well, at least we’re not Nebraska or Notre Lame. Hyuk, yuk, yuk. It’ll be a blue moon before Meechigan has to worry about making a bowl. Speakin-a-wich … Z, pass me another! Salud.” Being a Michigan fan was like living in the Shire.
And then I woke up one morning with a blue moon in my eye*. What’s more it was like I walked out of the bedroom to an empty house. The wife, the kids, the dog, the furniture, even my dirty and beaten toy football; any and every anchor of my life—my identity—gone. Gone. All that remained were unfaded rectangles on the walls, where our family pictures once hung, and an infestation of dust bunnies. No warning. No note. Just nothing. [Screw] you, cheese ball. [Screw] you.
Uh, right. Back to football.
Though I didn’t see it at the time, looking back, it almost seems predictable that the team struggled in Rodriguez’s first two seasons. The changes in culture and strategy were just enormous; more, I think, than anyone could have possibly anticipated. Add on top of that the structural problems in the makeup of the team that Misopogon articulated so well and, yeah, we might have been able to see it coming. Maybe not 8-16 but, we might have had a clue.
So, as a new season approaches, I’ve tried to see if I could gauge how many games Michigan can win next season. Not for some silly reason like setting an ultimatum I have no agency in setting but because I want to properly cup my soul dong this time. Well, I woke up this morning and I got myself a gun. By got I mean built, and by gun I mean multivariate least squares linear regression model. (Yeah, I like gun better too). Anyway, my gun says Michigan has a reasonably legitimate shot at, (gulp), 9 wins.
Lock, Stock, and Barrel
The data I used to put the model together were end of year offensive yards gained per game, defensive yards allowed per game, and win percentage for all FBS schools from the 2003 – 2009 seasons. I went for yards per game over points per game for two reasons. The first reason is pragmatic; it would be prohibitive to remove special teams and defensive scoring from the scores of the over 800 seasons (about 10,000 games) in the data set. Even if I were prepared to do it Mathletically, the necessary data don’t exist for all the games I used(2003-2005).
The second reason is that the better team doesn’t always outscore the opponent. Take Wisconsin v. Michigan 2008 as a case in point. In that game Wisconsin outgained Michigan 384 to 268 but Michigan won 27 – 25 thanks to an interception returned for touchdown. Even then, Wisconsin was a failed 2-point conversion from forcing overtime and probably winning the game in the extra period. While one example will never prove a point, I trust that reasonable people would agree that this is not an isolated situation.
As for the data, no modifications were made. Again, stripping out FCS schools poses issues of practicality and necessity. The practical aspect has already been mentioned. As to necessity, the point of the model is to tease out winning percentage and an extreme mismatch is a valid data point for this purpose. Actually, it's really interesting to leave them in because doing so captures behavior that is rarely seen. A game like Delaware State v. Michigan in 2009 should be a virtual lock for a team like Michigan, and though it’s not entertaining for the fans, it is a valid demonstration of the phenomenon that is being modeled. No adjustment for strength of schedule is made either because it is a retrospective model. This will be further explained in two paragraphs.
After doing the math, the results were better than I expected. The regression was able to account for about 67% of the variation of the data just by using Offensive and Defensive yards per game averages. The remaining 33% would be accounted for by other factors like turnover margin, non-offensive scoring, kicking game reliability, and so on. For my fellow nerds out there, the p-value for each coefficient of the model has at least 50 zeroes in front of the first significant digit. For my non-nerd brothers and sisters: that ish be money, yo. Just don’t go gambling with it; you’ll lose.
It’s important to note what this model actually does. It takes retrospective data and uses it to explain what happened. It says, if you actually achieve X-level of offense and Y-level of defense you can expect to win Z-percent of your games. Even then, 33% of the outcome is determined by things that aren’t dependably predictable such as recovering a fumble, housing a punt, and your kicker’s frost resistance. For projection purposes, the only thing that needs to be assumed is the likelihood that a team can achieve the necessary levels of offensive and defensive production. Wuh woh, we all know what happens when you make assumptions; you make an ass out of u and…mptions.
One last comment about the modeling phase; turn-overs are a huge factor. I was able to dig up turnover margin data for the 2009 season and adding that to the model and rerunning with only 2009 data doesn’t really boost the significance of the model that much but it allows us to see just how big a knob TOM is. A turnover margin of +1 per game is good for about a 12% boost in win percentage all else being equal. That’s about 1.5 games over the course of a season. Friggin yuge.
Ultimately, I lumped turnover margin back into the general mayhem bin because visualizing things in 4 dimensions is either impossible or complicated, depending on your major. Also, the NCAA doesn’t track turn-over margin and I was unable to find more than 1 season’s worth of data (2009). The reliability of this model depends on the large number of data points used to generate it so that’s what I wanted to protect the most.
Cheney-Whittington Memorial Chart (aka – Scattershot, in yo’ face!)
Okay. I trust no explanation is necessary. Let's move on.
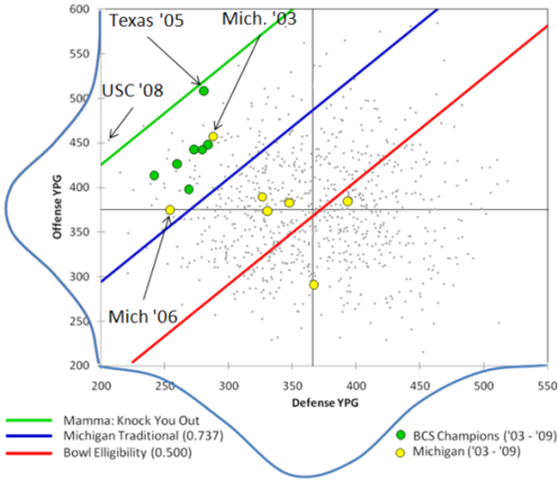
Psych, there are a few things going on here:
- The galaxy of points is there for decoration, and to show that this is real data.
- The bell curves outside each axis are there to help get a sense the distribution of offensive and defensive production. Also for stat nerds, they show that the assumptions needed for linear regressions are verified.
- The cross hairs show the average offense and defense over the course of the 7 seasons that were used for the project.
- The two colored groups of points are Michigan in yellow and the BCS Champions in green over the period covered.
- The three diagonal lines are generated by the model. They are iso-win lines drawn at the bowl eligibility threshold (.500), Michigan’s Traditional Average (.737), and ,for fun, Predictably Undefeated (1.000; aka the momma said knock you out line). If you are to the left of one of these lines you have achieved that milestone.
A couple of notes:
- It is not necessary to be a “predictably undefeated” team. In fact, only 1 of the 7 BCS champions captured were anywhere near that line.
- There is some nice internal validation shown here in that a team that plays average defense and average offense is expected to win about 50% of its games.
- Teams of equal power line up at levels parallel to the green, red and blue lines. Notice how the BCS Champions line up nicely just below the green line.
- News Flash: Defense wins championships. It’s sooo cliché because it’s sooo true. All of the BCS Champions on this chart played much better than average defense but only slightly better than average offense. That is not to say that offense doesn’t matter (they all played above average offense too), but with out a great defense you have no shot at the title.
- Michigan had only one team in the period captured (2003) that had the look of a national champion if they had earned the opportunity. Incidentally, Florida 2006 is the lowest championship team shown.
Last season Michigan’s year-end averages were 393.3 ypg on defense and 384.5 ypg on offense for a prediction 47% or 5.6 wins out of 12. Michigan actually won 5. So, how does the model spit out a number anywhere near 9 wins for next year?
Let’s make an ass out of umptions.
That Shotgun Shine: Offensive Expectations
In this third year, Michigan should be approaching spread-n-shred steady state. If not, we’re in trouble and, in all likelihood, RichRod is gone. I figure the most important difference between this year’s offensive outlook and last year’s is the fact that we wont be forced to have a freshman QB starting. So, for what that level of production (spread option with experienced QB) looks like we should look toward our nearest approximations: Rodriguez era West Virginia and Meyer era Florida. The following chart shows how each offense progressed in executing the spread option. I’ve split the WVU data into two groups: with Pat White and without Pat White since, you know, we don’t know if we have a QB as prolific as Pat White.
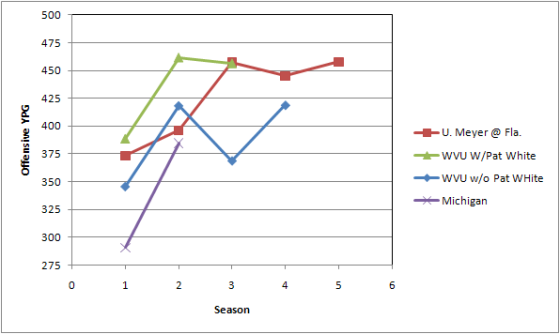
In both White’s and Tebow’s sophomore seasons, their respective offenses gained an average of about 450 yards per game and leveled off there. Both improved 50-75 yds per game from their freshman campaigns. Without a White/Tebow Level player it looks like WVU was capable of about 410-425 ypg at steady state with again a 75 ypg improvement from year 1 to year 2.
The effect shows up at other programs, too. Penn State improved 40 yards per game in Darryl Clark’s second year as starter. Notre Dame gained 100 yards more per game (!!!) in Jimmy Clausen’s second year as starter. Even Tressel ball gained an additional 30 ypg in Terrelle Pryor’s second season and he was neither a polished passer nor used as a consistent running threat.
It’s not unreasonable to think that Michigan can produce 425 – 450 ypg of offense this year. There are really no excuses on offense this year. The offensive roster is stacked with a normal level of talent and experience at all positions, and they’re all familiar with the system. We’ll see if the spread option works in the Big Ten or not, homies.
Roulette Anyone?: Defensive Hopespectations
Ugh, I don’t want to do this but…I’ve got a gun to my head. (Ha!) I look through split fingers…
Ok, this is much more difficult an exercise. Here, the most drastic change is that we lost our three best players off a team that gave up 400 ypg. No biggie. Generalizing, the concerns are about the roster. The benchmarks I’ll use here are: Minnesota, Northwestern, and Purdue all from 2009. None of those teams had Brandon Graham, Donovan Warren, or Steve Brown either. Yet, they all played a current Big Ten Schedule, they’d all trade their defensive rosters for ours in a heart beat, and they were all able to beat teams we couldn’t. The range of performance for those 3 goes from 344.3 to 376.7 ypg. That represents an improvement vs. Michigan 2009 of 25-50 ypg.
Incidentally, 375 ypg is what Michigan allowed in 2008. So, yeah, that’s not a stretch of the imagination by any means. While the peaks of Michigan’s defense might be lower this year, the valleys should be higher. There were a lot more valleys than peaks last year.
350 – 375 ypg it is.
Pull the Trigger&Sights on the Future
So, low expectations: OYds = 425; Dyds = 375. Weed Smoked expectations: Oyds = 450; Dyds = 350. Beep, Bop, Bip, Bope, Boop…err, I mean, ka-BOOM! Projected Win % = 0.593 – 0.700. That means Bowl Eligibility, which means 13 games, which means 7.7 – 9.1 wins.
If that scenario indeed plays out, is it that hard to envision a scenario in 2011 where Michigan is in contention for the MNC? The offense is already within striking distance of steady state Florida and West Virginia and it’s not crazy to think that the defense would have the capacity to improve another 50-75 ypg with a full squad of talented and experienced returning players. 2011: Offense = 450; Defense = 300.
Here’s another Cheney-Whittington Chart:

This time I’ve separated the Michigan cluster into two groups: pre-Rodriguez and post-Rodriguez. Then I added what I think are reasonable projections for the 2010 and 2011 seasons.
When Rodriguez was hired I think the majority of people thought that Michigan would be in contention for the national championship by year 3 or 4 depending on their level of optimism. The drastic step back the team took in 2008 blew those expectations out of the water. But after doing this analysis, it doesn’t seem that we’re as far off track as I thought when I started this project.
Going forward, I’d like to investigate if championship teams share common characteristics in terms of roster depth and experience, turn-over margin, kicking game reliability, and so on. I’ll also take a look at the teams we have coming up on our schedule to see what direction they are moving in and to gauge how much general mayhem we’ll need to go in our favor next season to meet these win projections.
---
* The inspiration for the theme of this diary was a result of listening to a song I’d never actually listened to before: the theme of the Sopranos. I prefer the Detroit Mix on iTunes because it’s performed in first person. Like I said, most things with me come back to Michigan Football.
I woke up this morning / Got myself a gun / Mama always said I'd be / The Chosen One.
One in a million / I believe you've got to burn to shine / I was born under a bad sign / With a blue moon in my eyes.
Woke up this morning / All that love has gone / Papa never told me / About right and wrong.
I’m looking good, baby / I believe I’m feeling fine / I was born under a bad sign / With a blue moon in my eyes.
I woke up this morning / The world turned upside down / Thing's ain't been the same / Since the Blues walked into town.
But I’m one in a million / I've got that shotgun shine / Born under a bad sign / With a blue moon in my eyes.
When I woke up this morning everything was gone. By half past ten my head was going ding-dong. Ringing like a bell from my head down to my toes; like a voice telling me there was something I should know.
Last night I was flying but today I’m so low. It’s times like these that make me wonder if I'll ever know the meaning of things as they appear to the others: wives, husbands, mothers, fathers, sisters and brothers.
I wish I didn't function—wish I didn't think—beyond the next paycheck and the next little drink. Well, I do so I made up my mind to go on. ‘Cause when I woke up this morning everything I had was gone.
April 18th, 2010 at 11:52 PM ^
April 19th, 2010 at 12:14 AM ^
April 22nd, 2010 at 10:11 AM ^
April 19th, 2010 at 10:27 AM ^
April 19th, 2010 at 10:12 AM ^
 Do you have your spreadsheet available? I would like to see which dots represented various teams.
April 21st, 2010 at 11:42 PM ^
April 22nd, 2010 at 10:15 AM ^
April 22nd, 2010 at 12:30 PM ^
Comments