Shotgun Yesterday, Shotgun Today, Shotgun Tomorrow, Shotgun Forever

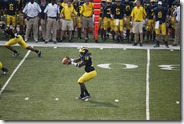
via flickr user larrysphatpage
Almost nothing drives me more insane than someone who proclaims certain numbers to be bad because these other numbers are better without suggesting a mechanism that would make this true. Via Slate, Murray Chass provides the canonical example:
The stats freaks who never saw a decimal point they didn't worship were ecstatic last year when Zack Greinke won the American League Cy Young award while winning only 16 games. Felix Hernandez, who won 19 and whose 2.49 earned run average was second to Greinke's 2.16, would have been my choice, but the stats guys "proved" that Greinke was the correct choice because of his statistical standing in formulaic concoctions in which we mere mortals do not imbibe.
—Murray Chass, murraychass.com, May 9, 2010.
This makes me clench and unclench my fists helplessly. It seems impossible that you could be this venerated New York Times baseball writer without picking up on the fact that AL pitchers have no control over how many runs their team scores. The fists clench and unclench because attempting to model an argument with Murray Chass about this quickly leads into a cul-de-sac where Chass says something condescending about something he doesn't understand and repeats it ad nauseum as if he believes "no blood for oil" or "drill, baby, drill" is a coherent, self-contained, impregnable point of view.
Presenting Jonah Lehrer, who actually manages to write for Wired despite being able to compose the following:
Consider the case of J.J. Barea. During the regular season, the backup point guard had perfectly ordinary statistics, averaging 9.5 ppg and shooting 44 percent from the field. His plus/minus rating was slightly negative. There was no reason to expect big things from such a little player in the playoffs.
And yet, by Game 4 of the NBA Finals, Barea was in the starting lineup. (This promotion came despite the fact that he began the Finals with a 5-for-23 shooting slump and a minus-14 rating.) What Dallas coach Rick Carlisle wisely realized is that Barea possessed something that couldn't be captured in a scorecard, that his speed and energy were virtues even when he missed his layups (and he missed a lot of layups), and that when he made those driving floaters their value exceeded the point score. Because nothing messes with your head like seeing a guy that short score in the lane. Although Barea's statistics still look pretty ordinary — his scoring average fell in the Finals despite the fact that he started — the Mavs have declared that re-signing him is a priority. Because it doesn't matter what the numbers say. Barea won games.
A man who writes for Wired ascribes JJ Barea's value to "nothing messes with your head like seeing a guy that short score in the lane." Fists clenching and unclenching due to impossibility of refuting argument that stupid. Plenty of other people have tried to do so. Some guy at Deadspin who pointed out that the Mavs are amongst the most stat-obsessed teams in the league. A Baseball Prospectus guy tore apart Lehrer's introductory car analogy, in which car buyers who focus on a couple of barely relevant but easily understandable numbers instead of the important, hard-to-quantity data are Bill James, not Joe Morgan.
It doesn't matter, though. These articles always have a tautologically number-negating logic. The argument goes:
- I don't understand statistics*.
- People who understand statistics don't understand intangibles.
- ???
- Therefore my understanding is superior.
Now let's talk about Denard Robinson and last year's offense.
*[This lack of understanding can be many things but is always at least this: statistics are a suggestive tool, not math gospel. To be fair, some people use statistics like they are a golden hammer. These people are very annoying and should be yelled at. Just don't throw the baby out with the bathwater. ]
Y WE NO SCORE GOALPOINTS
This came up a lot in the aftermath of the Spring Game, when the quarterbacks strove to make themselves indistinguishable from walk-ons and quite a lot of people put finger under collar and went "uggggghhh." This was met with a round of backlash largely consisting of people pointing at select—sometimes hilariously select—statistics from last year's team in an effort to prove the offense wasn't really that good.
The favorite was a focus on the first halves against good opponents, when Michigan did not score points. This did not escape notice even around here:
The Ohio State game has the power to make whatever happens in it seem like Michigan's season in microcosm, and so the overriding theme of the 2010 season is looking up at the scoreboard at halftime to see Michigan on pace for about 500 yards and about twenty points. Michigan had 238 yards and seven points this time around and instead of a competitive game we got the usual.
Michigan was frustratingly spectacular at getting to the half with almost 300 yards and something like ten points on the board. But using points to evaluate the output of an offense is like using wins to evaluate a pitcher. Events outside the entity you are trying to evaluate have so much impact on that number, it is only a fuzzy explanation of the story.
I have engaged in message board fights and observed many more about whether the Wisconsin game was a failure on the offense's part. At the half the score was 28-0 Wisconsin and the game was as good as over, whereupon Michigan came out of the locker room and scored three straight touchdowns against the UW defense. This would have made the game interesting if Michigan could have forced the Badgers to pass, ever.
My fists do the clenching bit whenever anyone tries to claim the Wisconsin game was evidence Michigan should move away from the spread. The Michigan offense's entire first half:
-
Michigan drives from their own one yard line to
the Wisconsintheir 35 before punting. - Michigan drives from their 28 to the Wisconsin 13; Seth Broekhuizen misses a 30-yard field goal.
- Three and out from the 36.
- Three and out from the 40.
(There was also a meaningless two play drive at the end of the half.) That's not a great four drives. It is a great seven drives if you consider the next three. Meanwhile, the final touchdown against UW is often dismissed as "garbage time" but Badger tacklers on that drive include JJ Watt, Patrick Butrym, and Aaron Henry—all starters—and Michigan hit Roundtree three times for more than 20 yards on a three-minute march. That was not Wisconsin's goal. Even if you still dismiss Michigan's last couple drives as garbage you have to acknowledge that the defense's inability to make them meaningful robbed the offense of opportunities to impress for real.
But you're sitting there and your fists are clenching and unclenching and everything is black and doom and blacky black doom, so maybe it's hard to tell.
Transistors don't give a damn
This is the disconnect. While what seems like a fairly large subset of the fanbase saw wholesale collapse in the Wisconsin game, computers saw two units failing immensely and an offense that put up 442 yards on a defense that gave up 321 on average, scored 31-ish points (computers will credit the offense with acquiring the field position for the field goal and deduct the miss from the special teams; if they deduct from the garbage TD they will use a lower denominator when trying to figure out expected points) on a defense that gave up 21. Statistically, Michigan's offense was at least a standard deviation above the mean against the Badgers.
While the Wisconsin game is the biggest outlier between the offense's actual and perceived performance, it's instructive. It is often lumped in with the crap from last year along with Iowa (tenuous case indeed there), MSU, OSU, and the bowl game. There is no reasonable case it should be. This is why statistics are useful, because meat-emotions often overwhelm our capacity for reason.
These are the questions I think we should be asking in our most robotic voices:
What aspects of last year's performance project most strongly to next year's?
There are three reasons for the gap between points and yards: field position, field goal kicking, and turnovers. The latter two combined to see Michigan's redzone scoring rate rank 109th nationally. The first two are almost entirely out of the offense's control. The latter was a huge problem all three years under Rodriguez. However, turnovers notoriously do not correlate year to year, are heavily dependent on quarterback, experience and saw Rich Rodriguez consistently in the black at West Virginia.
Michigan's turnover issues aren't fate, should improve naturally, and are not related to the spread. Most of Michigan's other issues at turning yards into points are not really the offense's.
That leaves an inherent flaw in the spread offense as a potential culprit that has the potential to repeat next year. Point in favor: Michigan was even worse in the redzone in 2009, finishing with just 49% of available points. Point against: Auburn and Oregon finished in the top ten last year. Further point against from a Football Outsiders study of the NFL:
We took … 20 overachievers and measured their performances the season after said overachievement; while their DVOA [ed: something value over average, a fancy stat they have designed to smooth out noise.] in the red zone that initial season exceeded their total offensive DVOA by an average of 33.3 percent, in the following season, their DVOA in the red zone exceeded their total DVOA by an average of 1.3 percent. In other words, the teams' performances in the red zone mirrored how they did outside it, implying the overachieving was a fluke.
We also can measure this by using correlation coefficients, a way of measuring the relationship between two variables that results in a number ranging from minus-1 (at which the two variables have an exact inverse relationship) to plus-1 (at which the variables have a perfectly positive relationship). The correlation between a team's performance in the red zone and its overall offensive performance, year to year, is 0.08 -- essentially nil. Teams simply do not exceed their performance in the first 80 yards once they get to the final 20 on a regular basis.
The evidence suggests Michigan's red zone struggles should revert to the mean; the things that made the offense less than the sum of its yards last year are all small sample size outliers.
What's left that does correlate, or at least correlates better? Everything else. On a play by play basis Michigan's offense does well in standard and advanced metrics, and returns ten starters. If they should be better but weren't (because of things that should revert) and can expect similar performance next year (because of all the returning starters), then what should happen is that the expected and actual meet somewhere south of #2 nationally but well within the schwing range.
Is it better to play to Al Borges's strengths or the offense's strengths?
In 2008 this was easy since the offense had no strengths. In 2011 it's a difficult question. Michigan's transition demands that Borges or Denard (and, importantly, the OL) leaves his comfort zone. This is necessarily going to be suboptimal for someone.
The spring game suggests it will be vastly suboptimal for Denard if Borges gets his way, and it seems a lot easier to change playcalls than turn Denard into Jon Navarre. Unfortunately, it's not that easy. The last few years I've documented the ever-evolving Michigan run offense. Rich Rodriguez kept ahead of the curve by constantly adding new wrinkles to the ground game. He was able to do this because of his vast experience with the spread 'n' shred. Al Borges is a smart guy with a lot of experience but his history suggests his inventiveness may be more oriented towards the passing game. If a good chunk of offensive effectiveness is staying ahead of the game, Borges might be able to do that better from a pro-style offense.
But the following is true even in the NFL:
Shotgun formations are generally more efficient than formations with the quarterback under center.
Over the past three seasons, offenses have averaged 5.9 yards per play from Shotgun, but just 5.1 yards per play with the quarterback under center. This wide split exists even if you analyze the data to try to weed out biases like teams using Shotgun more often on third-and-long, or against prevent defenses in the fourth quarter. Shotgun offense is more efficient if you only look at the first half, on every down, and even if you only look at running back carries rather than passes and scrambles.
With an offense outright designed for the shotgun featuring a quarterback whose main asset is his legs, the cutting-edge effect would have to be absurdly important to make the offense more effective from under center.
Does I-form pro-style help you win in ways undefined by conventional statistics?
This is Brady Hoke's theory when he denigrates the zone-heavy spread offense as an impediment to having a good defense. A quick glance at the top defenses in both conventional and fancy measures suggests this is unlikely. TCU, Boise State, and West Virginia were the top three teams in yardage defense. WVU, Missouri, Oklahoma, Auburn, Oregon, and Mississippi State are all in the top ten in defensive FEI. There appears to be little if any problem with having a top defense opposite your spread 'n' shred offense as long as you account for the increased pace of the spread.
Is it worth sacrificing effectiveness down the road for immediate results?
Unknowable, but there's no better way to quickly put the question marks on Brady Hoke's resume to rest than by having a breakout first season.
Extensive Conclusion Section
MOAR SHOTGUN PLZ
/s...there is nothing more to say until we see some football...one man's shotgun is another man's Iso...not all shotgun is the same. We will see if we can run between the tackles well enough to create waggle opportunities for Denard if he truly is going to be under center.
Brian brings up some great points. I don't see any ulterior motive to trash the new offense before it's played a down. I am betting we'll get our wish for more SDSU Borges analysis in the coming weeks and it will be dizzyingly detailed.
Based on Borges' track record overall, we gotta be pretty confident we are in good hands. The overlooked factor is Denard's ability to improve drastically from year to year. The guy puts in the work and is clearly a mental giant. I'll lay money he'll surprise us all as far as his ability in this type of offense. Only a fool would bet against the guy.
.Black TEA Which do you prefer BKACK is the meaning of , the world's first black TEA by the China fujian wuyi mountain TEA TEA farmer invention Black tea sort is more, <a href="http://www.voguehighheelshoes.com/" >christian loboutin</a> producing area wider is the shoots of tea tree leaves as raw material, called "the mountain is the"., ermentation, dry and other typical process refined but become. from China developed India,
for the sake of discussion, let's say points are not the best metric for evaluating an offense, total yards is not much better, in fact it may be worse. Some analysis I read a few years back (maybe even by Brian) pointed to 3'rd/4'th down conversion, yards per rush and number of plays over 20 yards. I was able to get a couple of these for UM in 2010:
3'rd down: 36'th
4'th down: 77'th (12 out of 28), UM was 10'th in attempts
ypr: 6'th
plays of 20 yds are longer: 24'th (SDSU was 7'th)
The 2010 UM offense was good, but not elite, not up there wtih Oregon, Stanford, Auburn, Boise, Nevada etc., so it wouldn't be the end of the world if they tinkered with it.



Comments