Moving the Stati-Sticks: Post-Rutgers

[Barron/MGoBlog]
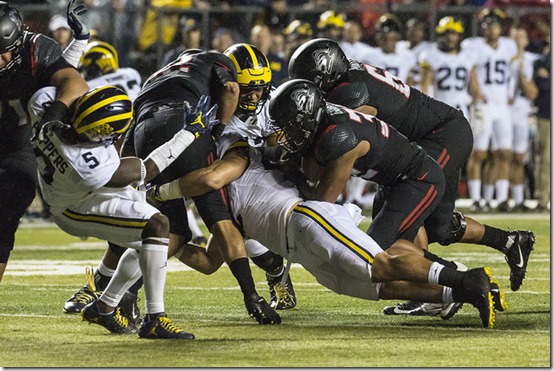
Bill Connelly used a photo from the Michigan-Rutgers game to head his Week Six Five Factors box scores, and it’s not hard to see why. Scrolling across the stats will lead to either your jaw dropping or some guttural chuckle, or maybe both: Rutgers averaged 0.28 yards per play, had one scoring opportunity (read: had the ball inside Michigan’s 40), got zero points off that opportunity, and had a Success Rate of 11%. Michigan’s offense averaged 8.11 yards per play, had 11 scoring opportunities, averaged 7.00 points per opportunity, and had a Success Rate of 55%. Rutgers had 17 drives to Michigan’s 18. Sometimes things really are as lopsided as the final score indicates.
ESPN’s Football Power Index took note, as Michigan now holds the top overall spot in FPI. ESPN says that FPI “represents how many points above or below average a team is.” Michigan’s 1.8 points better than the next nearest team (Alabama), and they’re 2.5 points better than Ohio State. One dominant game over Rutgers really boosted Michigan’s stock in the eyes of ESPN, as their chance at winning out rocketed from 16.6% to 34.2%, and their chance of winning the conference jumped from 30.8% to 49.5%. ESPN also predicts Michigan will win 11.8 games.
The season outlook wouldn’t be nearly as shiny if the offense wasn’t above average, but it’s no secret that the defense is performing at a level we haven’t seen in quite a while and driving the numbers up. There is literally no section of Connelly’s advanced stats profile where Michigan’s defense isn’t ranked first nationally in some category. The defense is even ranked first in two of Connely’s Five Factors. I decided to take a closer look at passing downs defense this week because it has been exceptional, but at this point the defense is so good that I don’t have to dig through specific categories for something to discuss so much as rotate through them. This week, the visual representation of the defense’s dominance is as sharp as it’s been in the last two seasons; before you read anything below, you can scroll through the graphs and see exactly what I mean.
[After THE JUMP: Connelly’s Five Factors and a closer look at passing downs defense]
Michigan’s defense continued to pull themselves out of the hole they dug early in the season as far as big plays ceded are concerned, and the offense has been ascending alongside them. The offense’s national rank jumped from 63rd to 48th after Rutgers, while the defense’s gain was more modest, moving from 95th to 89th.
It’s valid to wonder why this number didn’t drop more after the defense stymied Rutgers. Explosiveness is measured via IsoPPP, and IsoPPP only looks at how big a play broke when it was successful (in terms of expected points based on yard lines); keep in mind that success in this case is defined as getting half the necessary yards on first down, 70% on second down, or 100% on third or fourth down. Michigan’s defense limited Rutgers Success Rate to 11% and, per Bill Connelly’s advanced stats box scores, they finished with 15 yards, which is as low as you’ll ever see against a P5 school. There just weren’t that many successful plays and said plays went almost nowhere, which means there weren’t many opportunities for IsoPPP to drop.
This is Michigan’s second consecutive week ranked #1 nationally in defensive Success Rate. The defense’s SR dropped about 2% this week, while the national average dropped from 40.9% to 40.7%. The offense’s SR percentage is the same as it was after week five, but they jumped from #51 to #44 in the national rankings.
Michigan’s offense is now starting with the best field position in the country. I counted five times against Rutgers where Michigan’s defense held them deep in their own territory and Rutgers’ punter subsequently failed to get the ball to Michigan’s side of the field. Their punter averaged 37.7 yards per punt on 16 punts, and Pro Football Focus graded him an unbelievably bad –8.8; if ever there was a game for Michigan to grab the top spot nationally, this was it.
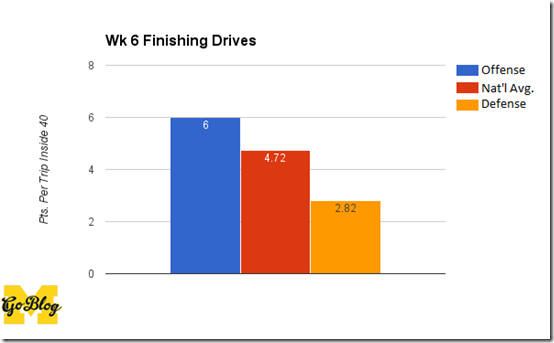
With regard to finishing drives, Michigan’s defense is #1 overall, while the offense is #6 overall. It seems that scoring points on offense and limiting them on defense leads to success. Novel. Rutgers got inside Michigan’s 40-yard line once in the game, and even so it wasn’t from a sustained drive of some sort. It came off of De’Veon Smith’s fumble in the first quarter; Rutgers then executed a three-play, two-yard drive and punted from Michigan’s 35.
Not much change in the turnover department this week. Michigan finished without one, and Connelly’s numbers had them with 0.22 expected TOs. That number gets tacked on to the running total, moving the Expected column a smidge closer to the Actual and dropping Michigan’s turnover luck by 0.73 points per game.
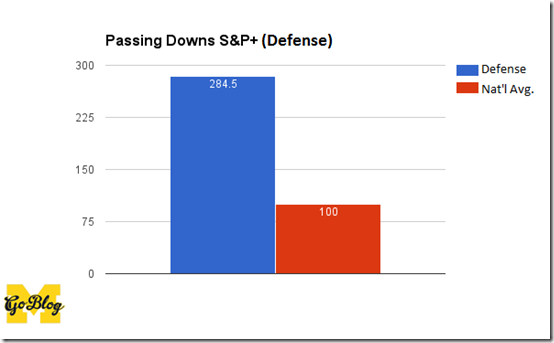
I could have picked a number of situational stats to take a closer look at this week—rush D, pass D, standard downs—but went with passing downs defense because, I mean, look at that. Connelly’s situational stats use 100 as the average (unlike the overall S&P+ number for offense and defense, which uses adjusted scoring averages), and Michigan’s marching headlong toward 300.
Per Football Outsiders, passing downs are 2nd-and-8+ and 3rd/4th-and-5+. To get a team into that kind of situation requires a pretty good defense; Michigan’s Standard Downs S&P+ is 174.0, tops in the country. To then be this good in and-long situations is insane.
This is the stat that I think of as the on-track number, where the Success Rate indicates how often an offense is able to pick up the yards they need to stay in a favorable situation as it relates to yards-to-go. Michigan’s opponents are able to get back on track about 13% of the time when they’re pushed into a passing down. Another way to think of it is if a team can’t pick up a modest three yards on first down, they’re incredibly unlikely to pick up the yards they need on second or third down. When Don Brown says he wants to take away the run and make teams one-dimensional, he’s delivering. When teams are one-dimensional and forced to pass, the 11 on defense are delivering.
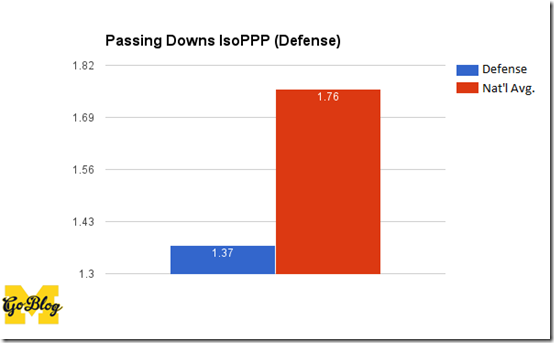
The IsoPPP number is interesting because it’s the one number that’s keeping the defense’s Five Factors box from looking exquisite. It’s worth noting that those few big plays teams ripped off early in the season didn’t come after the defense had held up on first or second or third down and forced the opposing offense into a long-yardage conversion situation; Michigan’s D is ranked second in the country in this area. There may be something there emotionally as far as not having to deal with the push and pull of holding up most of the time and then busting, but that falls outside the scope of some graphs I whipped up in Google Sheets using Connelly’s numbers.
With Michigan playing as much man coverage as they do, you’d think that a team might be able to pick up a chunk of rushing yards here and there when it looks like the defense is going to have to defend the pass first. So far, that hasn’t been the case, as Passing Downs Line Yards per Carry is another stat in which the defense ranks among the country’s top five. Opposing offensive lines have been unable to get any push against Michigan’s D-line, and the linebackers and DBs are cleaning things up in a hurry when teams don’t run directly into the fangs of the front four.
Another stat, another area in which Michigan is top five nationally. I don’t want to delve into corporate jargon too heavily lest I bring back memories of He Who Must Not Be Named (no, not Voldemort), but the word that keeps coming to mind is “synergy.” As I mentioned above, the secondary has to be really dang good to play as much man as they do, and the front four have to stay disciplined and in their rush lanes while also generating some pass rush. The linebackers have to do a little of both, sometimes dropping into coverage and sometimes rushing the passer while maintaining gap integrity. That these guys are able to actually get to the quarterback, and that Don Brown is able to put them in plays where blitzers are as annoying and unexpected to the QB as that push notification on your phone you swear you stopped, is a testament to how well the DC and the defense work together.
October 14th, 2016 at 10:12 AM ^
October 14th, 2016 at 10:18 AM ^
On big plays ceeded...
October 14th, 2016 at 11:10 AM ^
October 14th, 2016 at 11:21 AM ^
I know we had a few busts early in the year but it seems impossible we're 89th in any defensive stat.
October 14th, 2016 at 11:35 AM ^
I'm guessing it's sample size issue. Michigan has not let any long sustained scoring drives, so the amount of snaps the defense has played is much smaller than the amount most other teams have seen. This makes the few big plays they've given up, a higher rate per play than other teams.
3 and outs will hurt the defenses ability to reduce this stat, vs giving up long 11 and 12 play drives, bu tthe 3 and out is the better scenario.
October 14th, 2016 at 11:50 AM ^
Also, maybe I'm wrong on this, but I believe the offense has to have a "successful" play to even figure in to the calculations of the explosiveness stat. So, since Rutgers only had an 11% success rate on about 50 snaps, only ~5 plays were added to the sample this week. Counterintuitively, the Explosiveness stat would look better if Rutgers had 10 5-yd runs instead of 9 0-yd runs and 1 10-yd run.
October 14th, 2016 at 12:59 PM ^
You are correct. Our defense has a success rate of 19.2% meaning that only 19.2% of all plays Michigan faces are measured in the explosive play category. The average team is being measured on 40.7% of their plays. UCF hit some chunks on the run when Taco was out and Michigan had some contain issues. Then Colorado hit a few big pass plays before Jourdan Lewis came back.
So not only is Michigan no longer ceding many long plays over the last 3 weeks, they also are so dominant that they have very little opportunity to recover their ranking in explosive plays. A good problem to have, to be sure.
October 14th, 2016 at 10:16 AM ^
So, really, who's got it better than us??
October 14th, 2016 at 10:55 AM ^
Except maybe future us! - Jim Harbaugh
October 14th, 2016 at 10:16 AM ^
17 drives to Michigan's 18 yard line. Crossing the 50 yard line would be entering Michigan terrority and Rutger's did not do that 17 times.
October 14th, 2016 at 10:20 AM ^
"18 yard line" I must have missed that or it was edited. But it meant Rutgers had 17 drives compared to Michigan's 18 drives.
October 14th, 2016 at 11:14 AM ^
October 14th, 2016 at 10:29 AM ^
Maybe they meant Rutgers had 17 drives past their own 18 yard line. Even then, that wouldn't be correct.
October 14th, 2016 at 10:29 AM ^
"seems that scoring points on offense and limiting them on defense leads to success"
Maybe these advanced stats are on to something! lol
October 14th, 2016 at 10:35 AM ^
Boo to bar graphs that don't start the y axis at zero!
October 14th, 2016 at 11:09 AM ^
Sent from MGoBlog HD for iPhone & iPad
October 14th, 2016 at 11:26 AM ^
October 14th, 2016 at 11:29 AM ^
Recover a fumble against Rutgers? It says they didn't have a turnover in the game, but perhaps it was meant to say that we were +0 on turnovers.
October 14th, 2016 at 11:48 AM ^
I had the same thought - it must be about turnover margin.
October 14th, 2016 at 2:27 PM ^
October 14th, 2016 at 11:45 AM ^
I know the dominant performance at Rutgers impacts these ratings a lot, but I have to believe (and have not seen it mentioned much) that the Penn St/Maryland game also helped UM's statistical profile significantly.
Penn St jumped from #51 to #39 in FPI and from #38 to #17(!) in S&P based on their dominant win agaist Maryland. The quality of that 49-10 win a few weeks ago has to really be buoying Michigan in both statistical models.


Comments