The Kobe Assist: Another Way Trey Burke Is Good At Basketball


All missed shots are not created equal.
That's the premise of this article by Grantland's Kirk Goldsberry, who examines the work of the NBA's foremost volume shooter, Kobe Bryant, and comes up with a very interesting new statistic. The background [emphasis mine]:
[J]ust like shot outcomes, rebounding outcomes also depend on who is shooting, where they are shooting from, the stratagems of each team, the rebounding abilities of each player, and the precise spatial configuration of the 10 players on the court; as a result, there is a less apparent tenet of basketball: All missed shots are not created equal, and their DNA is inherently dependent upon their ancestral events — some missed shots are good for the defensive team, and some benefit the offense, as many misses actually extend offensive possessions with the proverbial "fresh 24."
Goldsberry coins the name "Kobe Pass" for any shot that is rebounded by the offense—an individual statistic for the shooter, as offensive rebounds is obviously a stat that exists. This leads to the "Kobe Assist":
In fact, league-wide, 34 percent of the time Kobe passes results in points right away because the recipient of the Kobe Pass, a.k.a. the offensive rebounder, frequently scores immediately after acquiring the basketball. In such cases, I define the Kobe Assist as an achievement credited to a player or a team missing a basket that in a way leads directly to the kind of field goal generally referred to as a put-back, tip-in, or follow.
In case you haven't caught on, Kobe Bryant is the master of the Kobe Assist, putting up the best numbers even before the Lakers brought in rebounding force Dwight Howard (having Pau Gasol and Andrew Bynum helped, of course).
While Kobe Assists depend in no small part on a player's supporting cast—the guys going up for the rebound, especially—there is still an art to their creation. Much of this has to do with where on the floor a player takes his shot; as a general rule, the closer to the basket a shot originates, the more likely an offensive rebound will occur:
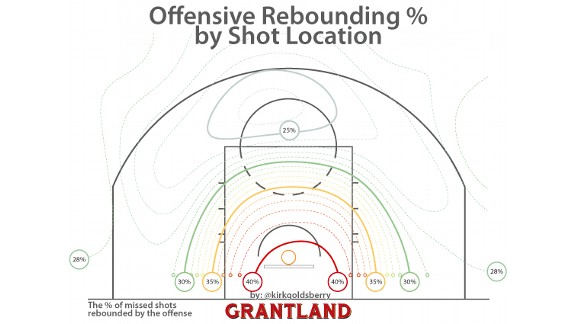
There is one notable exception: three-pointers are rebounded at a lightly higher clip than long twos. This is an NBA chart, so the stats for college may be slightly different, but the point remains that long twos are the worst shots in basketball—often a waste of possession not only because of their low-percentage nature and lack of the upside of a potential extra point, but also because they're usually the last shot of a possession.
[Hit THE JUMP to see the best Wolverines at producing Kobe Assists as well as a new advanced metric, adj. points per shot]
Charting Michigan's Kobe Assists
This lengthy preamble leads to a point beyond noting a cool new stat, of course. I went back through the play-by-plays for each of Michigan's regular-season games and tallied Kobe Passes and Kobe Assists for each player who's seen significant time (Caris LeVert is the one notable exclusion from the current rotation, but I plan to track these all year and he'll get in once he plays more). Chart? Chart.
| Player | 2PA | 2PM | O. Reb. | KA | 3PA | 3PM | O. Reb | KA |
|---|---|---|---|---|---|---|---|---|
| Trey Burke | 75 | 42 | 13 | 5 | 39 | 14 | 10 | 2 |
| Tim Hardaway | 63 | 37 | 3 | 1 | 39 | 14 | 9 | 1 |
| Nik Stauskas | 30 | 14 | 5 | 4 | 38 | 23 | 6 | 1 |
| Glenn Robinson III | 53 | 32 | 4 | 0 | 21 | 8 | 4 | 1 |
| Jordan Morgan | 45 | 28 | 6 | 4 | 0 | 0 | 0 | 0 |
| Mitch McGary | 36 | 23 | 5 | 0 | 0 | 0 | 0 | 0 |
| Spike Albrecht | 7 | 3 | 2 | 1 | 8 | 3 | 2 | 0 |
| Matt Vogrich | 6 | 3 | 1 | 0 | 9 | 3 | 1 | 1 |
| Jon Horford | 12 | 5 | 5 | 1 | 0 | 0 | 0 | 0 |
| TEAM | 327 | 187 | 44 | 16 | 154 | 65 | 32 | 6 |
It's early in the season, so there are serious sample size issues with these numbers; with that noted, a few trends have emerged. For one, there's a stark difference between two-point shots and three-point shots. Michigan rebounds 31.4% of the charted two-point misses and immediately converts 36.4% of those rebounds. The Wolverines actually pull down a higher percentage of three-point misses—40.0%, in fact—but only tally Kobe Assists on 18.7% of those opportunities. This makes sense—three-pointers tend to bounce further away from the basket, making an immediate putback more difficult.
Burke And Hardaway
Then we get to the individual players, and the contrast between Tim Hardaway Jr. and Trey Burke. Hardaway's two-point shots are rebounded at a remarkably low rate (11.5%), and only one of his 26 misses has been immediately converted into points. On the other hand, 39.3% of Burke's two-point misses result in offensive boards, and 38.4% of those find the net within seconds.
To look at it another way, when Trey Burke takes a two-point shot, Michigan either scores or gets a fresh 35 on the shot clock an incredible 73.3% of the time; they score off the shot or immediate putback at a 62.7% clip. While Hardaway's two-point shooting percentage is actually higher than Burke's (58.7% to 56.0%), his twos result in points or a new shot clock 63.4% of the time, with scores or putbacks at a 60.3% rate.
Hardaway's numbers are quite good, of course, but this is just another way to show Burke's impressive efficiency; his ability to take what the defense gives him without forcing the issue is why he's the best point guard in the country, period. Here's an example of one of his Kobe Passes (a should-be Kobe Assist, but the play-by-play charted an attempted Jordan Morgan tip-in before his eventual putback):
Even though Burke misses the shot, he creates the rebounding opportunity by beating his man off the dribble and forcing Morgan's defender to slide over and help, leaving Morgan all alone under the basket.
In contrast, here's one of Hardaway's dreaded long twos:
By settling for a long jumper (with 14 seconds on the shot clock, no less), Hardaway doesn't force any extra defender to commit to him, allowing NC State to account for all of Michigan's potential rebounders. The shot goes off the mark, and NC State rebounds easily.
To his credit, Hardaway hasn't settled as much for those type of shots, but his style still doesn't lend itself to Kobe Assists nearly as much as Burke's. Hardaway takes more jump shots than Burke—in part because he can rise above a defender at just about any time—even when he beats a player off the dribble; Burke's more likely to go all the way to the rim, which draws more help.
Holy Stauskas
I'll repeat the sample size caveat—caveat: small sample size—before this next stat: 76.3% of Nik Stauskas's three-pointers result in a made basket or offensive rebound. Caveats aside...

Even though he's not as lethal from two, Stauskas is still taking smart shots—63.3% of his twos either go in or get rebounded, and an even 60% result in points either directly or via putback. This is despite Stauskas only making 14 of his 30 two-point attempts this year. When he goes inside the arc, however, he tends to aggressively attack the basket, creating those second-shot opportunities.
Michigan's bigs have also proven adept at creating multiple opportunities to score with their shot selection—not a huge surprise given their shots mostly originate from around the basket. It also helps when you do this:
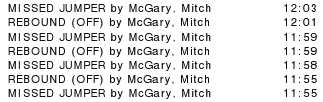
That may have skewed McGary's numbers a tad. Also likely an anomaly: Jon Horford's five Kobe Passes on seven missed shots.
Introducing Adjusted Points Per Shot
When I showed these numbers to Brian, he suggested a new metric, incorporating the Kobe Pass/Assist numbers into a player's points per shot. The formula: (2*2FG + 3*3FG + 2*KobeAssists + [team's points per possession][KobePasses - Kobe Assists]) / FGA.
In layman's terms, add a player's points to the points scored directly off his misses and the (admittedly approximate) expected points scored when the team gets a rebound off his miss and doesn't immediately put a shot back up, all divided by his field goal attempts. This gives the expected number of points a team will score on a possession in which a certain player takes a shot. I've dubbed this stat "adjusted points per shot," and Michigan's numbers are as follows:
| Player | Adj. PPS (2P) | Adj. PPS (3P) | Adj. PPS (Total) |
|---|---|---|---|
| Trey Burke | 1.38 | 1.42 | 1.39 |
| Tim Hardaway | 1.24 | 1.37 | 1.29 |
| Nik Stauskas | 1.24 | 2.02 | 1.68 |
| Glenn Robinson III | 1.30 | 1.41 | 1.33 |
| Jordan Morgan | 1.47 | - | 1.47 |
| Mitch McGary | 1.44 | - | 1.44 |
| Spike Albrecht | 1.31 | 1.42 | 1.37 |
| Jon Horford | 1.39 | - | 1.39 |
Jiminy Cricket.
Is Stauskas's number sustainable? Probably not. Do I care right now? No. That number says when the ball leaves his hand, Michigan will on average score 1.68(!) points on that possession—2.02(!!!) when he shoots a three—and I be like dang all over again.
This metric also illustrates the difference between Burke and Hardaway, as well as the quiet efficiency of Glenn Robinson III, who—albeit in a smaller role—currently rates better than Hardaway. Michigan's post players score the best inside the arc; since the vast majority of their shots originate from directly around the basket, this is not a surprise.
I'll be keeping track of this stat all year, and as the season goes on much of the noise in the numbers will fade away. At any rate, Trey Burke is pretty damn good at basketball, and Nik Stauskas is Michigan's best shooter in a very long time.
December 11th, 2012 at 2:09 PM ^
Should be a fun "Meta-Stat" to track throughout the year. Maybe it will be incorporated into those games deserving of basketball UFRs?
December 11th, 2012 at 2:16 PM ^
Basketball UFRs are D-E-D dead—way too much time for something with dubious actual value. I'll start doing more post-game analysis and stuff like the above, however, especially once Big Ten season starts. Looking into doing some stuff with shooting heat maps; Michigan compiles shooting data for the home games, and I just have to figure out how to put it into a database and produce the charts. (If anyone has suggestions or knowledge of how to do so, please get in touch with me.)
December 11th, 2012 at 2:20 PM ^
It does take a long time to pull those together for such frequent games over a number of months. Maybe week to week "Stat Checks" per player/for the team that will look at the past week's stats, compare them against the season average, and/or compare them against the previous week's averages. Doesn't have to be weekly either I suppose, no clue how long something like this would take either.
December 11th, 2012 at 2:24 PM ^
That's a definite possibility—still bouncing around a couple of ideas, but I like that.
December 11th, 2012 at 3:56 PM ^
Over at umhoops, they do a weekly form tracker kind of like US soccer style ratings 1-10 of each player as an individual. Not sure how much advanced metrics are used, but it's something like what you are asking for. They do a pretty good podcast too featuring guys like Dave Merritt and CJ Lee. They even interviewed the guy whose ranking system had Michigan 44th or something to start the season. Also they do a great job of looking at recruits up to and including the class of 2016(!).
December 11th, 2012 at 2:13 PM ^
Hopefully this will stop much of the bitching about players missing shots. Quality missed shots win games.
I hope I don't internalize this too bad effect and begin to root for M's opponents to make shots and M to miss shots. Potentially very confusing.
December 11th, 2012 at 2:13 PM ^
Great stat that proves Stauskus is the best hoops recruit in the past 2 decades....period. Stats don't lie.
I'm a hoops junkie and eat this sh$t up. Great stuff.
December 11th, 2012 at 2:33 PM ^
"Lie, Damn Lies, and Statistics" for 300 please?
December 13th, 2012 at 5:46 AM ^
Stats do sometimes lie. Sometimes not. There are good/bad, relevant/irrelevant statistics. It doesn't seem you're being sarcastic, but I feel you must be by making a ridiculous claim like this stat proving Stauskas is the best hoops recruit in the last 20 years. There are so many problems with that statment.
December 11th, 2012 at 2:15 PM ^
He's attempted one fewer three than Trey and Tim, but he's made nine more than either of them. They're decent three-point shooters at 35.9%, but he's something else entirely.
December 11th, 2012 at 2:20 PM ^
It seems like you'd see a bump (over the team average at least) this whenever your worst rebounder shoots, assuming that getting your own rebounds (a la McGary) is rare.
December 11th, 2012 at 2:36 PM ^
It's much more likely that Hardaway gets an oReb on a Burke miss than the other way around. That's going to skew the numbers a bit.
December 11th, 2012 at 4:04 PM ^
Well yeah, but that's part of the advantage of having that guy shoot the ball. I guess it depends on if you are looking at the stat as an indicator of performance within a team context or purely individual.
December 11th, 2012 at 2:26 PM ^
I know our offense is pants-tent-tastic but can it really be THAT efficient that EVERYONE's numbers are that much higher than 1?
I guess the Kobe assist numbers get double counted because they are someone else's actual points?
December 11th, 2012 at 2:28 PM ^
Yeah, don't try to translate the individual numbers to team numbers—that produces the doubling up that you anticipated. Michigan is at 1.17 points per possession, which is still quite good.
December 11th, 2012 at 2:28 PM ^
Can you incorporate being fouled and FT rate? Wouldn't that be even more precise?
December 11th, 2012 at 2:34 PM ^
I love the stat and the nerdy nature that prompted this detailed post. However, there's one obvious caveat that you sort of glossed over given that you used THJ as an example here.
Currently THJ is the team's second leading rebounder and his rebounding rates are also very impressive. So every time a Burke shot goes up, chances are that Hardaway is chasing the rebound. Every time a THJ shot goes up, Burke is headed the other direction to stifle a potential fast break for the other team.
I guess what I'm saying is that THJ is hurt in this stat as much by the fact that he will be less likely to rebound his own miss as he is hurt by his shot selection. It is still a valuable shot and does a good job of emphasizing "shot quality", but this is something to keep in mind when looking at detailed comparisons of players.
(I'm sure with enough time and effort you could calculate these metrics for Burke with and without Hardaway on the floor to see the true benefit he adds on Burke's misses.)
December 11th, 2012 at 2:37 PM ^
This is a great point. Burke is certainly helped by having the team's best four rebounders available to hit the glass after his shot.
That said, I still think Burke's style is more conducive to creating offensive rebounds. The gap may not be as wide as it appears in the post, however.
December 11th, 2012 at 4:57 PM ^
... namely, attack the basket. If you beat your guy, no one might help and you get a layup. If someone helps, you can pass it to someone for a layup (or open 3, these days). If you can't pass, you still might get close enough that you get a good shot; if you miss, someone else should have attacked the basket and get the rebound. (I don't think I still have the Johnny Orr ditto-machine (!) instructions from his basketball camp that talk about this, but if he was talking about it to 10-year-olds ...)
Until the advent of the 3-point shot, post players dominated basketball; this is part of the reason. If they get a good shot and miss, they're in position for a rebound a lot more.
While the "Kobe Assist" strikes me as just another way to assign blame for the Laker's predicament to everyone but the aging-but-still-All-World-gunner, the kernel of truth at the center is timeless: There are layups/shots in the paint, and three-pointers. Sometimes there are 12'-15' open jumpers. Everything else is inferior.
December 11th, 2012 at 4:59 PM ^
So every time a Burke shot goes up, chances are that Hardaway is chasing the rebound.Hardaway actually does most of his board work on the defensive end. On the offensive glass it's primarily the bigs who do the heavy lifting.
December 11th, 2012 at 2:39 PM ^
I think it also helps when you are a player that all defenders are worried about helping out on, e.g., Kobe. But sure, shot location is a thing too.
December 11th, 2012 at 2:42 PM ^
December 11th, 2012 at 3:01 PM ^
Perhaps not a new concept but I did enjoy the breakdown and stats to allow for more objective conclusions to be able to be drawn from which are "good shots" vs. "bad shots" (the long 2 with a lot of clock left vs drawing help and a short 2 are good examples)
December 11th, 2012 at 3:54 PM ^
Sure, I was not attempting to knock the analysis. Maybe the kid from Grantland really thought he came up with a new way of looking at basketball when he says "We fail to explore the interactions between shot events and put-backs." I don't know who he is talking about when he says "we" but when Larry Brown talks about playing the game the "right way" this what he is talking about. People around the game of basketball intiutively understand this and coach it. I wish Kirk Goldsberry would acknowledge that in his article. I am sure plenty of teams already keep stats similar to his "new" stat.
Analyzing Trey Burke with better metrics is great, completly worthy of a blog post and an example of how Ace has stepped the basketball coverage up here. Not in any way being critical of him.
I'd like a stat that says how much a players effeciency is increased by being the designated free throw shooter at the end of games. I will call it the Lavell Blanchard.
December 11th, 2012 at 3:02 PM ^
This is what I was thinking when I read the Grantland post yesterday. I always thought Iverson was underrated by the stats nerds because they didn't account for his drives to the hoop that would draw two or three defenders.
Great post by the way Ace. I love this kind of analysis!
December 11th, 2012 at 2:45 PM ^
that Kobe wrote that article himself... or atleast forced Kirk Goldsperry to write it.
December 11th, 2012 at 3:51 PM ^
for his low "Kobe rating," which might in part be so. But he's also not running the offense most of the time like Trey, right? Working from the top of the key, for example. They have different roles in the offense, are shooting from different places at different moments of the shot clock, with different groups of people underneath and spaced around the floor, different instructions from the coach. To do this right you'd want to look at where both players shoot from (if Hardaway shoots a lot more the side of the court, that could account for your discrepancy in one fell swoop). Trey runs the team, but Hardaway pulls many more rebounds.
I would be interested to compare Hardaway's long-range twos YTD with last year; at least at the outset this season he was popping from short range in much more effective fashion than last year, from what I could see.
December 11th, 2012 at 3:06 PM ^
Great stuff. Thanks for figuring this all out and posting it!
Keep up the great work.
December 11th, 2012 at 3:22 PM ^
December 11th, 2012 at 3:22 PM ^
I can see the theory behind this, but unless a player has an obviously high number over a long period of time, it seems that there are so many other factors involved to really put much stock in it. But, assists are completely dependent on the receiving player to make the shot too, and that's a pretty universally accepted stat. It will be interesting to see where this goes, and it would be interesting to see these numbers calculated for M opponents (or everyone) so we have a frame of reference.
December 11th, 2012 at 3:32 PM ^
So basically what this is saying is that Stauskas is costing the team points by taking anything other than 3s. (Yes, unsustainable rates and all, but damn, we've got 9 games of data, even with the dubious quality of opponents noted.)
December 11th, 2012 at 5:22 PM ^
The team scores ~2 points per possession that Stauskas takes a 3. So they just need Stauskas to shoot a 3 on every possession, and with the Kobe stuff it will average out to being the same as scoring a 2 point bucket on every trip right? So with Michigan having about 63 possessions per game, that's 126 points per game, every game. Math.
December 11th, 2012 at 3:43 PM ^
i think Shot Maps would be a great idea.
Shots from certain areas of the floor tend to get rebounded at different rates.
Beilein's offense is set up to create shots for different positions from different spots on the floor.
You never see GRIII taking a 3-pointer from the top of the key, for example.
December 11th, 2012 at 4:39 PM ^
Long twos, while not valuable shots on their own, are valuable as part of a multi-possession strategy. If you abandon long twos, or avoid all but the most open ones, you are essentially ceding a part of the floor that the defense does not have to cover. It's especially important that your 2/3 (ie Hardaway) demonstrate this threat, as he is most often operating in that part of the floor (the 1 is on the perimeter setting up the offense, and the 4/5s will be near the basket, except in certain plays like the screen in roll, in which case a long two capable 4/5 is very valuable - think Tim Duncan or Dirk Nowitzki). Now that doesn't mean all of Hardaways long twos are advisable as part of this strategy, but it can explain why Beilein allows him to take them at all.
December 11th, 2012 at 4:53 PM ^
good to see solid numbers backing an interesting stat. and i finally have an excuse for why i miss so many shots in pick-up... i do it for the team!
December 11th, 2012 at 6:36 PM ^
Great post, this is an interesting metric to look at as far as overall scoring created by a player.
Also, I don't even have to look up the play where McGary shot, missed and rebounded himself like 5 times. Hilarious.
December 11th, 2012 at 9:01 PM ^
Interesting thoughts on the kobe assists...
http://wagesofwins.com/2012/12/10/putting-back-the-kobe-assist/
Comments