Hokepoints: Law & Order in the Big Ten

I've been slowly building and picking through an all-plays database built from NCAA.org's play-by-play data. The easiest thing to pull out so far has been penalties, so let's play with those.
The benefit of the all-plays is you can tell the difference between penalties, since a personal foul says a different thing about a team and does a different thing to them than, say, a delay of game to set up a punt. I broke the various penalties up into "Violent" and "Non-Violent" behaviors.
- Acts of violence: Clipping, crackbacks, facemasks, illegal blocks, illegal use of hands, kick catch interference, pass interference (?), roughing the kicker (15), roughing the passer, tripping, and unnecessary roughness.
- Non-violent behaviors: Delay of game, encroachment, false starts, holding, ineligible receiver downfield, intentional grounding, kickoff out of bounds, offsides, running into the kicker (5), sideline interference, substitution infraction, too many men, unsportsmanlike conduct, and illegal fair catch, formation, forward pass, motion, participation, shifting, and touching.
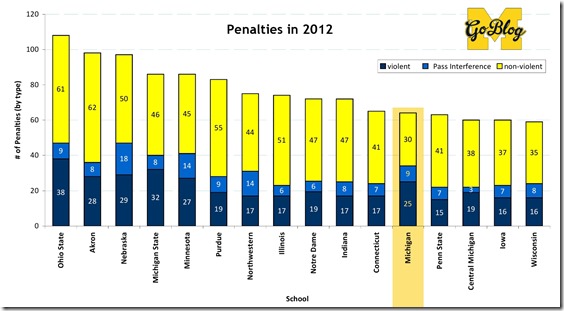
Michigan last year was remarkably good at avoiding the latter type. I tracked the Big Ten plus our 2013 opponents and Michigan had fewer of the non-physical (yellow) calls go against them than any other team:
lol…osu?
I don't know if I want to count PI since its application can get downright chintzy, so that's broken out. Either way Ohio State managed to lead the study in infractions despite playing a game or two fewer than most of the others. Reason why this is? Online poll says:
4.5% of people who take any online fan poll are Buckeyes
I was surprised that Michigan State appeared to have their pugilistic streak in relative check, i.e. they were only among the leaders, not far ahead as I supposed from watching them. It takes a while to gather all the data but minus the regular season Wisconsin game (data wasn't available) their 2011 penalty numbers were high but their personal foul quotient wasn't: 31 violent (11 of those pass interference), but a ridiculous 60 non-violent. Wanna guess where a disproportionate of those came from? Offsides. #JerelWorthyJumpsEarly.
Michigan vs. Average
We're dealing with smallish sample sizes so conclusions are shaky. That said there are things to see when you look at which penalties Michigan was getting called against them versus a typical team on their schedule.
Non-violent things per season:
| Penalty | Avg Team | Mich | OSU | ND | MSU'12 | MSU'11 |
|---|---|---|---|---|---|---|
| False Start | 14.3 | 7 | 21 | 21 | 13 | 20 |
| Holding | 12.8 | 13 | 14 | 11 | 15 | 12 |
| Offsides/Encroachment | 6.4 | 7 | 6 | 4 | 8 | 20 |
| Illegal Offensive Stuff | 4.6 | - | 5 | 5 | 5 | - |
| Delay of Game | 3.3 | - | 5 | 3 | 1 | 4 |
| Coach Derps | 2.2 | 3 | 3 | 2 | 2 | 2 |
| Intentional grounding | 0.8 | - | 1 | - | 1 | - |
| Unsportsmanlike Conduct | 0.8 | 1 | 4 | - | 1 | 1 |
| Special Teams Derps | 0.4 | - | - | 1 | - | - |
| TOTAL | 45.6 | 30 | 61 | 47 | 46 | 60 |
Michigan's veteran offensive line was good for something last year: remarkably few false starts and none of those illegal formation/procedure things that plagued us in various offensive transitions. That's a feather in Al Borges's cap: the offense had their fundamentals down about as well as you can ask. If you want to correlate offensive line experience with success at avoiding pre-snap penalties (I haven't proven this. Further study: is it experienced OL or just experienced tackles? Inquiring 2013 offensive lines want to know.
Violent crimes per season:
| Penalty | Avg Team | Mich | OSU | ND | MSU | MSU'11 |
|---|---|---|---|---|---|---|
| Personal Foul | 13.7 | 10 | 24 | 9 | 21 | 16 |
| Pass Interference | 8.8 | 9 | 9 | 6 | 8 | 11 |
| Various Illegal Blocks | 4.8 | 8 | 8 | 4 | 6 | - |
| Facemask | 1.6 | 2 | 4 | 3 | 1 | 1 |
| Roughing the Passer | 1.0 | 3 | 2 | 1 | - | 3 |
| Kick Catching Interference | 0.6 | 2 | - | 1 | 2 | - |
| Roughing the Kicker | 0.3 | - | - | - | 2 | - |
| Unnecessary Roughness | 0.1 | - | - | 1 | - | - |
| TOTAL | 30.8 | 34 | 47 | 25 | 40 | 31 |
Average, the only thing standing out being chopblocks. There were a few of these called against Michigan last year that I thought were horsecrap (Mealer's v. UMass and Gallon's vs. Minnesota), and here's one that was legit (on Gordon):
If you don't spot it in 10 watches, watch it 10 more times.
I'm declaring Michigan a very average team at this.
Home Field Advantage?
There is one, usually. Michigan was almost twice as likely to get a penalty called against them on the road—that was an outlier. You could say it's because we got hosed on the road, or because Michigan Stadium is a major home-field advantage. Given the paucity of calls per game that went against the Wolverines in the Big House, I'd have to say that appears the more likely:
PENALTIES PER GAME
| Team | Tot/G | Home | Away | Neutral | % Diff on Road |
|---|---|---|---|---|---|
| Michigan | 4.9 | 3.3 | 6.2 | 6.5 | +86% |
| Purdue | 6.8 | 5.4 | 8.2 | 9.0 | +51% |
| Akron | 8.2 | 6.7 | 9.7 | - | +45% |
| Northwestern | 5.8 | 5.4 | 7.0 | 2. | +29% |
| Connecticut | 5.4 | 5.0 | 5.8 | - | +17% |
| Nebraska | 7.1 | 6.7 | 7.8 | 7.0 | +16% |
| Iowa | 5.0 | 4.9 | 5.5 | 4.0 | +13% |
| Illinois | 6.2 | 5.9 | 6.6 | - | +13% |
| Penn State | 5.3 | 5.0 | 5.6 | - | +12% |
| Central Michigan | 4.6 | 4.3 | 4.8 | 6.0 | +12% |
| Notre Dame | 5.5 | 6.4 | 6.0 | 1.5 | -7% |
| Wisconsin | 4.2 | 4.4 | 4.0 | 4.0 | -10% |
| Minnesota | 6.6 | 6.9 | 6.0 | 8.0 | -13% |
| Ohio State | 8.5 | 8.9 | 7.8 | - | -13% |
| Indiana | 6.0 | 6.7 | 5.3 | - | -20% |
| Michigan State | 6.6 | 7.1 | 5.6 | 8.0 | -22% |
| Other Opponents | 6.5 | 7.1 | 6.2 | 6.8 | -12% |
| AVERAGE | d | d | d | d | +42% |
But it could as well mean Michigan is more well-behaved at home. Interesting that being on the road actually helped some teams, particularly Michigan State.
...to a comparison of Michigan teams over the past 10 years or so?
Interesting analysis. It'd be interesting to see how Brady Hoke's teams have done vs other coaches with regard to penalties over time (non-violent vs violent). That might speak to how well a coach has command over his players
It'd be interesting to see if Michigan State has more violent penaltys per game vs Michigan than their other non rival opponents.


Comments