trevor siemian is a throw-god
Upchurch
Bill Connelly a few years back created a new uberstat for receivers called RYPR (receiving yards/total team plays *Passing S&P+). His description:
Below, you will find a measure that attempts to answer the following questions about a given pass-catcher:
- 1) How much do you produce?
- 2) How important are you to your team's passing game?
- 3) How good is the passing game to which you are important?
- 4) And how much is the forward pass featured in your team's offense?
The idea was to simply multiply the following four factors together: a player's Yards Per Target, his Target Rate, his team's Passing S&P+, and his team's pass rate. Target Rate x Yards Per Target x Passing S&P+ x Pass Rate = RYPR.
He last updated this in October. So I updated, using data made available by cfbstats.com, and Fremeau's S&P+ team rating. Here's all 1,167 guys with at least 10 targets in 2013:
https://docs.google.com/spreadsheets/d/1rkk-xZfImYtSw-RSE2OJKatAayoPbUA_AdFsGSF9J8s/edit?usp=sharing
Let's skip right to Michigan
I went through several iterations trying to match exactly what Connelly had done, so this may not match the results I reported beforehand. Here's the breakdown of Michigan's targets with NCAA averages in parentheses:
| Target # | Receiver | RYPR (NCAA avg) | Yards/Tgt | Target Rate |
|---|---|---|---|---|
| 1 | Jeremy Gallon | 178.0 (102.6) | 10 (8.6) | 32% (23%) |
| 2 | Devin Funchess | 97.0 (68.8) | 8.1 (8.1) | 21% (17%) |
| 3 | Drew Dileo | 22.6 (49.5) | 5.8 (7.8) | 7% (12%) |
| 4 | Jake Butt | 30.5 (36.6) | 8.7 (7.7) | 6% (9%) |
| 5 | Jehu Chesson | 28.7 (27.0) | 9.2 (7.2) | 6% (7%) |
| 6 | Fitz Toussaint | 26.3 (20.9) | 10.2 (6.7) | 5% (6%) |
| 7 | Jeremy Jackson | 9.2 (17.1) | 7.1 (7.0) | 2% (5%) |
Funchess's 97.0 was 22nd among teams' second targets though his yards per target were average for No. 2 guys. The max protect stuff in the season's third quarter (Indiana through Nebraska) bore out in the numbers, with that third receiver (Dileo) far under the typical third receiver's usage.
Best Receivers in a Bad B1G
Gallon wasn't the only long term top receiver to graduate last year, and the conference wasn't very deep on receiving talent to begin with. The result is not many wideouts left in-conference to have cracked that 100 (average for a team's best receiver) mark. In 2013 the Big Ten average RYPR for its teams' top three receivers was 69.5, last among major conferences and just ahead of the Sun Belt and Conf USA. When I removed all seniors the Big Ten was behind the MAC (Conference USA was still very worse). Here's the best among those that remain.
| Receivers | Team | Tgt | Rec | Yds | YPT | Tgt Rt | 1st Dn% | RYPR |
|---|---|---|---|---|---|---|---|---|
| Devin Funchess | Michigan | #2 | 49 | 748 | 8.1 | 24.7% | 36% | 113.6 |
| Christian Jones | Northwestern | #2 | 54 | 668 | 8.7 | 21.2% | 52% | 98.1 |
| Tony Jones | Northwestern | #1 | 55 | 616 | 7.7 | 22.0% | 39% | 90.5 |
| Shane Wynn | Indiana | #3 | 46 | 633 | 9.7 | 14.3% | 35% | 89.0 |
| Devin Smith | Ohio State | #2 | 44 | 660 | 9.0 | 20.9% | 34% | 88.7 |
| Levern Jacobs | Maryland | #1 | 47 | 633 | 8.8 | 18.2% | 31% | 88.1 |
| Stefon Diggs | Maryland | #3 | 34 | 587 | 10.5 | 14.2% | 43% | 81.7 |
| DeAngelo Yancey | Purdue | #1 | 32 | 546 | 7.8 | 18.2% | 30% | 78.9 |
| Deon Long | Maryland | #5 | 32 | 489 | 8.9 | 13.9% | 36% | 68.0 |
| Kenny Bell | Nebraska | #2 | 52 | 577 | 6.6 | 24.5% | 34% | 68.0 |
Maryland has lots of receivers. Northwestern's Joneses were pretty productive, and could be more so in a Trevor Siemian offense. The tight ends:
| Tight Ends | Team | Tgt | Rec | Yds | YPT | Tgt Rt | 1st Dn% | RYPR |
|---|---|---|---|---|---|---|---|---|
| Tyler Kroft | Rutgers | #1 | 43 | 573 | 8.3 | 16.8% | 45% | 72.1 |
| Jeff Heuerman | Ohio State | #4 | 26 | 466 | 12.9 | 10.3% | 44% | 62.6 |
| Maxx Williams | Minnesota | #2 | 25 | 417 | 10.4 | 15.7% | 50% | 57.1 |
| Dan Vitale | Northwestern | #3 | 34 | 382 | 6.7 | 15.7% | 32% | 56.1 |
| Justin Sinz | Purdue | #2 | 41 | 340 | 6.2 | 14.3% | 36% | 49.1 |
| Jesse James | Penn State | #3 | 25 | 333 | 8.3 | 10.2% | 33% | 39.0 |
| Jake Butt | Michigan | #4 | 20 | 235 | 8.7 | 7.3% | 48% | 35.7 |
Remind me to draft Heuerman in the draft-o-snark.
This hurt. [Fuller]
Longtime readers will know the MGoBlog policy on sacking: sacks and sack yardage should be counted as passing, because they are pass plays, not rushing, as the NCAA and thus everybody else is wont to do. Counting sacks as passing leads to a better understanding of success and where yards come from, and prevents problems like the computer in the NCAA videogames passing every play because the sacks that generates keep making the rushing numbers look progressively more awful.
For the Hail to the Victors preview books (kickstarter coming soon) each year we put these "At-a-Glance" boxes into the opponent previews, complete with offensive and defensive stats that we've adjusted for this. Having done the calculations for that, I thought I'd share them with you.
First, the difference it makes to passing stats:
| 2013 Passing | Unadjusted | Sack-Adjusted | ||||||||
|---|---|---|---|---|---|---|---|---|---|---|
| Team | Pass Att | Pass Yds | YPA | Rk | Sacks | Sack Yds | YPA | Rk | ||
| Indiana | 470 | 3680 | 7.83 | 2nd | 18 | 121 | 7.29 | 1st | ||
| Ohio State | 368 | 2846 | 7.73 | 3rd | 22 | 135 | 6.95 | 2nd | ||
| Penn State | 409 | 3110 | 7.60 | 4th | 22 | 135 | 6.90 | 3rd | ||
| Michigan | 395 | 3221 | 8.15 | 1st | 36 | 270 | 6.85 | 4th | ||
| Wisconsin | 355 | 2562 | 7.22 | 6th | 16 | 94 | 6.65 | 5th | ||
| Illinois | 455 | 3452 | 7.59 | 5th | 30 | 231 | 6.64 | 6th | ||
| Iowa | 375 | 2562 | 6.83 | 10th | 15 | 61 | 6.41 | 7th | ||
| Michigan State | 430 | 2964 | 6.89 | 9th | 17 | 127 | 6.35 | 8th | ||
| Nebraska | 378 | 2557 | 6.76 | 11th | 17 | 140 | 6.12 | 9th | ||
| Northwestern | 382 | 2726 | 7.14 | 8th | 36 | 198 | 6.05 | 10th | ||
| Minnesota | 267 | 1925 | 7.21 | 7th | 27 | 170 | 5.97 | 11th | ||
| Purdue | 426 | 2590 | 6.08 | 12th | 38 | 265 | 5.01 | 12th | ||
By counting sacks as passing Michigan drops from 8.15 yards per attempt (good for the best passing team in the conference last year) to a more realistic 6.85 YPA, dropping them to fourth. Minnesota's passing game dropped from middling to awful, Iowa's climbed from the bottom to the middle.
And the difference to running stats:
| 2013 Rushing | Unadjusted | Sack-Adjusted | ||||||||
|---|---|---|---|---|---|---|---|---|---|---|
| Team | Rushes | Rush Yds | YPC | Rk | Sacks | Sack Yds | YPA | Rk | ||
| Ohio State | 635 | 4321 | 6.80 | 1st | 22 | 135 | 7.27 | 1st | ||
| Wisconsin | 557 | 3689 | 6.62 | 2nd | 16 | 94 | 6.99 | 2nd | ||
| Indiana | 458 | 2422 | 5.29 | 3rd | 18 | 121 | 5.78 | 3rd | ||
| Nebraska | 584 | 2804 | 4.80 | 4th | 17 | 140 | 5.19 | 4th | ||
| Illinois | 411 | 1668 | 4.06 | 10th | 30 | 231 | 4.98 | 5th | ||
| Minnesota | 586 | 2538 | 4.33 | 5th | 27 | 170 | 4.84 | 6th | ||
| Northwestern | 507 | 2069 | 4.08 | 9th | 36 | 198 | 4.81 | 7th | ||
| Penn State | 501 | 2088 | 4.17 | 8th | 22 | 135 | 4.64 | 8th | ||
| Michigan State | 569 | 2433 | 4.28 | 6th | 17 | 127 | 4.64 | 9th | ||
| Iowa | 556 | 2338 | 4.21 | 7th | 15 | 61 | 4.43 | 10th | ||
| Michigan | 498 | 1634 | 3.28 | 11th | 36 | 270 | 4.12 | 11th | ||
| Purdue | 319 | 805 | 2.52 | 12th | 38 | 265 | 3.81 | 12th | ||
Michigan's awful running game is still awful, but it no longer looks like the Scheelhaase option-running game was a disaster. Ohio State's 7.27 YPC isn't just first among the conference; OSU and Wisconsin were the #1 and #2 rushing offenses in the country. Michigan: 115th out of 125 teams.
This isn't perfect since quarterback scrambles still can't be pulled out of rushing stats, but that's not so big of a deal considering a running QB should be contributing to your rushing success.
[Jump for Devin Garder's passing season and profiles of next year's opponents]
Formation notes: We've already talked about Michigan's 3-3-5 at the end of the game, which was really blue for some reason:
filmed in post-apocalyptic-Denzel-Washington-vehicle-o-vision
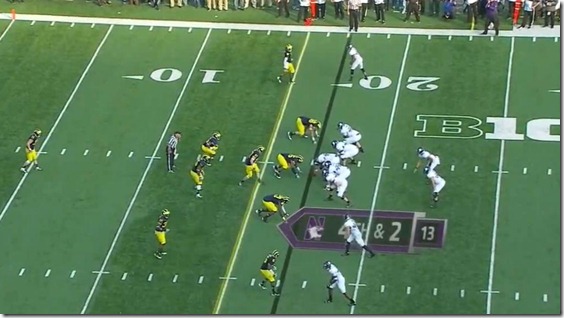
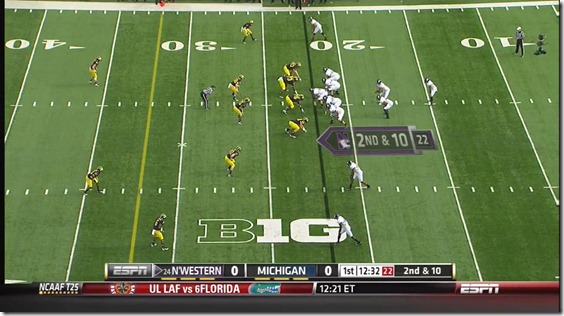
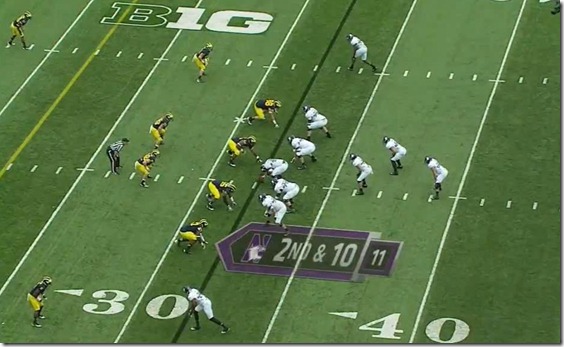
The rest of it was as per usual. Michigan goes with an even front against spread packages and flares the LBs out to deal. This results in things like this…
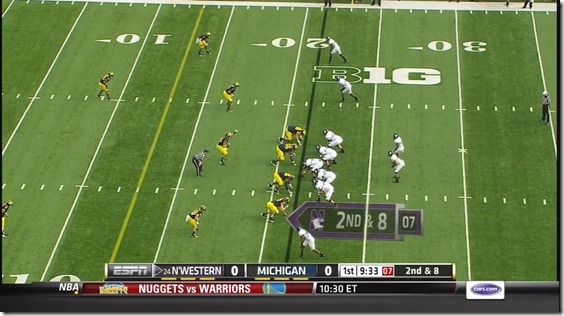
…and is a declaration of immense faith in the DTs. Here's Ryan over the slot again:
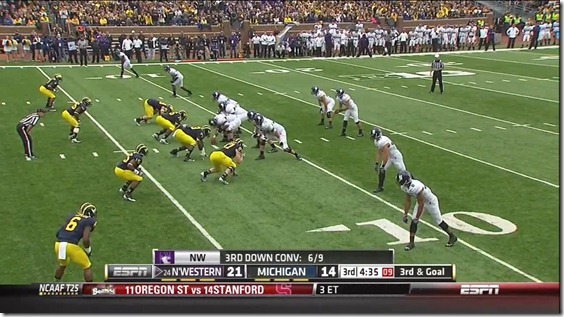
Michigan used some super wide splits once, when they were sick of getting edged by the option:
This was a FB dive that looked dangerous before Pipkins spatted the ballcarrier for two yards.
Finally, here's something. What? I'm not sure. THANKS DIRECTOR GUY
I swear these guys who come in and think they're Football Tarantino.
Substitution notes: Secondary as it always is. The front seven saw the same rotation they have in the last couple games, with CGordon/Bolden/Ross backing up Ryan/Demens/Morgan at LB and Heitzman/Black/Pipkins/Clark backing up Roh/Campbell/Washington/Beyer. Heitzman's increased PT continued; Bolden got relatively few snaps. Ross got more, including the last drive, but maybe not as many as I expected he did going in.
[AFTER THE JUMP: getting gashed, responding, Kovacs in your grill]
10