sack-adjusted
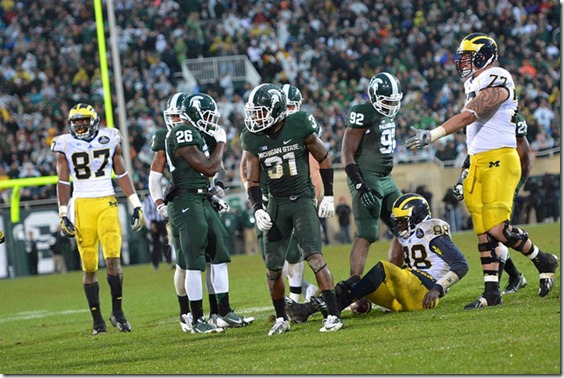
This hurt. [Fuller]
Longtime readers will know the MGoBlog policy on sacking: sacks and sack yardage should be counted as passing, because they are pass plays, not rushing, as the NCAA and thus everybody else is wont to do. Counting sacks as passing leads to a better understanding of success and where yards come from, and prevents problems like the computer in the NCAA videogames passing every play because the sacks that generates keep making the rushing numbers look progressively more awful.
For the Hail to the Victors preview books (kickstarter coming soon) each year we put these "At-a-Glance" boxes into the opponent previews, complete with offensive and defensive stats that we've adjusted for this. Having done the calculations for that, I thought I'd share them with you.
First, the difference it makes to passing stats:
| 2013 Passing | Unadjusted | Sack-Adjusted | ||||||||
|---|---|---|---|---|---|---|---|---|---|---|
| Team | Pass Att | Pass Yds | YPA | Rk | Sacks | Sack Yds | YPA | Rk | ||
| Indiana | 470 | 3680 | 7.83 | 2nd | 18 | 121 | 7.29 | 1st | ||
| Ohio State | 368 | 2846 | 7.73 | 3rd | 22 | 135 | 6.95 | 2nd | ||
| Penn State | 409 | 3110 | 7.60 | 4th | 22 | 135 | 6.90 | 3rd | ||
| Michigan | 395 | 3221 | 8.15 | 1st | 36 | 270 | 6.85 | 4th | ||
| Wisconsin | 355 | 2562 | 7.22 | 6th | 16 | 94 | 6.65 | 5th | ||
| Illinois | 455 | 3452 | 7.59 | 5th | 30 | 231 | 6.64 | 6th | ||
| Iowa | 375 | 2562 | 6.83 | 10th | 15 | 61 | 6.41 | 7th | ||
| Michigan State | 430 | 2964 | 6.89 | 9th | 17 | 127 | 6.35 | 8th | ||
| Nebraska | 378 | 2557 | 6.76 | 11th | 17 | 140 | 6.12 | 9th | ||
| Northwestern | 382 | 2726 | 7.14 | 8th | 36 | 198 | 6.05 | 10th | ||
| Minnesota | 267 | 1925 | 7.21 | 7th | 27 | 170 | 5.97 | 11th | ||
| Purdue | 426 | 2590 | 6.08 | 12th | 38 | 265 | 5.01 | 12th | ||
By counting sacks as passing Michigan drops from 8.15 yards per attempt (good for the best passing team in the conference last year) to a more realistic 6.85 YPA, dropping them to fourth. Minnesota's passing game dropped from middling to awful, Iowa's climbed from the bottom to the middle.
And the difference to running stats:
| 2013 Rushing | Unadjusted | Sack-Adjusted | ||||||||
|---|---|---|---|---|---|---|---|---|---|---|
| Team | Rushes | Rush Yds | YPC | Rk | Sacks | Sack Yds | YPA | Rk | ||
| Ohio State | 635 | 4321 | 6.80 | 1st | 22 | 135 | 7.27 | 1st | ||
| Wisconsin | 557 | 3689 | 6.62 | 2nd | 16 | 94 | 6.99 | 2nd | ||
| Indiana | 458 | 2422 | 5.29 | 3rd | 18 | 121 | 5.78 | 3rd | ||
| Nebraska | 584 | 2804 | 4.80 | 4th | 17 | 140 | 5.19 | 4th | ||
| Illinois | 411 | 1668 | 4.06 | 10th | 30 | 231 | 4.98 | 5th | ||
| Minnesota | 586 | 2538 | 4.33 | 5th | 27 | 170 | 4.84 | 6th | ||
| Northwestern | 507 | 2069 | 4.08 | 9th | 36 | 198 | 4.81 | 7th | ||
| Penn State | 501 | 2088 | 4.17 | 8th | 22 | 135 | 4.64 | 8th | ||
| Michigan State | 569 | 2433 | 4.28 | 6th | 17 | 127 | 4.64 | 9th | ||
| Iowa | 556 | 2338 | 4.21 | 7th | 15 | 61 | 4.43 | 10th | ||
| Michigan | 498 | 1634 | 3.28 | 11th | 36 | 270 | 4.12 | 11th | ||
| Purdue | 319 | 805 | 2.52 | 12th | 38 | 265 | 3.81 | 12th | ||
Michigan's awful running game is still awful, but it no longer looks like the Scheelhaase option-running game was a disaster. Ohio State's 7.27 YPC isn't just first among the conference; OSU and Wisconsin were the #1 and #2 rushing offenses in the country. Michigan: 115th out of 125 teams.
This isn't perfect since quarterback scrambles still can't be pulled out of rushing stats, but that's not so big of a deal considering a running QB should be contributing to your rushing success.
[Jump for Devin Garder's passing season and profiles of next year's opponents]

14