moeller effect
Several months ago Brian left a few whacky meatball surgeons in charge of the B.L.O.G. 4077th unit while he did the wedding/honeymoon thing. In need of good filler we duly turned over content control to the enlisted, then didn't use any of their ideas. Then TrapperVH and Major Tim Burns left the show and we forgot 'em, but this query from a non emu:
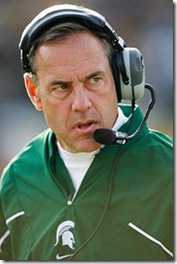
… When Hoke was hired, Brandon alluded to some research that he had done on correlation between the background of a new head coach and his winning percentage. He basically said that coaches who had previously coached in the conference, played, or recruited in the catchment area of a B10 school was much more likely to be successful than a complete outsider, and this was one of the reasons that made Hoke a more compelling candidate. …
…resulted in an excel spreadsheet (Google doc) that I've been tinkering with ever since.
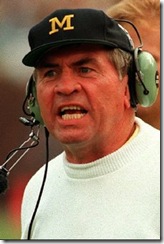
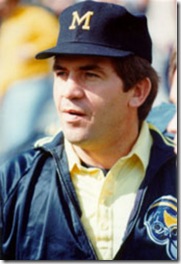
We may call this the Gary Moeller effect since he is the epitome of a guy with longstanding Big Ten experience before he took his marquee Big Ten head coaching job. Mo started working for Bo at Miami (NTM) and after '69 the only years he wasn't coordinating something for Michigan were three spent as the head coach of Illinois. But he's also the antithesis for the Illini years, when Moeller went 3-18-3 in the Big Ten, way worse than before him.
At Michigan, Moeller became the most successful Big Ten coach in the last 40 years (ties counted for 0.5 each, records through 2010):
| Rk | Coach | School | Yrs | B10 Wins | B10 Losses | B10 W% |
|---|---|---|---|---|---|---|
| 1 | Gary Moeller | Michigan | 1990-'94 | 31 | 5 | 86.11% |
| 2 | Bo Schembechler | Michigan | 1969-'89 | 144.5 | 25.5 | 85.00% |
| 3 | Jim Tressel | OSU | 2001-'10 | 66 | 14 | 82.50% |
| 4 | Lloyd Carr | Michigan | 1995-'07 | 81 | 23 | 77.88% |
| 5 | Earle Bruce | OSU | 1979-'87 | 57 | 17 | 77.03% |
| 6 | John Mackovic | Illini | 1988-'91 | 22.5 | 9.5 | 70.31% |
| 7 | Bret Bielema | Wis | 2006- | 27 | 13 | 67.50% |
| 8 | John Cooper | OSU | 1988-'00 | 70 | 34 | 67.31% |
| 9 | Jim Young | Purdue | 1977-'81 | 26.5 | 14.5 | 64.63% |
| 10 | Mark Dantonio | MSU | 2007- | 21 | 12 | 63.64% |
(Penn State is excised because when JoePa took over every team was in the Pangaea Conference. Bo Pelini too, for the same reason: not with the conference when they became HC).
Defining success isn't that straightforward. John Cooper* and Earl Bruce won a lot of Big Ten games at OSU but both were -9.5% in conf. winning % versus the 10 years preceding them while Hayden Fry (+32%), Joe Tiller (+25%), and Gary Barnett (+21%) dramatically improved moribund programs. When I compared every coach over the last 40 years to the 10 years before he arrived, I got this for best and worst:**
| Coach | School | Yrs | B10 W% | 10 Years before him | Change | |
|---|---|---|---|---|---|---|
| 1 | Bo Schembechler | Michigan | 1969-'89 | 85.00% | 49.28% | +35.72% |
| 66 | Rich Rodriguez | Michigan | 2008-'10 | 25.00% | 78.75% | -53.75% |
But then the W% method is really unfair to coaches who took over great teams. Lloyd Carr is a hall of fame coach who won around 78% of his Big Ten games over 13 years in a tough conference environment, but versus '85 to '94 he's –2.36%, good for about average. John Pont made the Top 10 for getting Indiana from 18% to 37%. Pont later reappears just outside the loser's bracket for taking over a 40% Northwestern team and winning just 25% of his conf. games. Using both metrics however can give us a list of dudes worth discussing from the last 20 years:
(after the jump):


30