hump day hypotheses
Title note: Since Brian moved this column to Wednesday morning, "Museday" is now "Hump Hypotheses," until that name also becomes stupid. New format, same old Miso soup.
Question: Against SD State we finally got to see Michigan play a full game against a pass-oriented offense. Against this Michigan usually sent four rushers, occasionally more. Last year I seem to remember this being three (out of a base 3-3-5) more often. I wonder if the extra rusher is making  Michigan more effective against the pass this year?
Declaration of biases: Eeeeee Mattison.
Research: Thx Brian for adding rush stats to UFR since ND 2010. Yoink. Since it's not available yet I had to do my own SD State charting. From this I took out anything that looked like an end-of-half/4th quarter prevent, plus all of the runs, big play-action, waggles, and any plays from inside the 10, which make it hard to gauge if there were any late blitzers. I also excised last year's game against Purdue because that was played in a monsoon against Perry the Torn ACLephant.* Then I went about determining if each of those plays was a "Win" for the defense, defined thusly:
- 1st down: If the offense gained less than 1/2 of the yards for a first down (so 5 yards from 1st and 10) that's a "Win"
- 2nd down: less than 2/3 of the yards to first down=Win
- 3rd or 4th down: if the offense does not get the 1st down
- Turnovers are obviously Wins.
Incompletes go for zero yards—if the pass went to Tacopants, well it's results-based charting. Have at it.
--------------------------------------------------------
*Michigan spent the whole day rushing three and this worked pretty much 90% of the time.
--------------------------------------------------------
Hypothesis: We were right to be saying "Michigan sends 3 ARRRGGGHHH!" last year. Sending four this year is helping the defense improve.
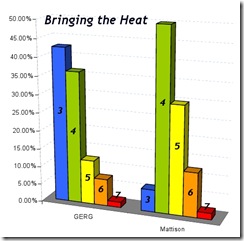
Let's test that: In case your eyes haven't picked this up already, Mattison sends more guys after the passer. He's averaging about 4.5 rushers per pass play, versus GERG's 3.9 among those we count from last year. Here's a tendency chart:
| Rushed: | 2 | 3 | 4 | 5 | 6 | 7 |
|---|---|---|---|---|---|---|
| 2010 (GERG) | 0.4% | 41.3% | 36.9% | 12.3% | 7.5% | 1.6% |
| 2011 (Mattison) | - | 6.1% | 50.0% | 29.8% | 12.3% | 1.8% |
This is not just a difference of a 4-3 defense versus a 3-3-5. Mattison has called a lot of zone blitzes where a DL backs into coverage, and the 3-3-5 is designed to often have one or two guys coming. Michigan's defense in 2011 is more aggressive than it was last year. Using the W/L formula above, let's see how much more effective it is because of that:
GERG in 2010:
| Rushed: | 2 | 3 | 4 | 5 | 6 | 7 | Total |
|---|---|---|---|---|---|---|---|
| Win | 1 | 61 | 43 | 18 | 10 | 3 | 136 |
| Loss | 43 | 50 | 13 | 9 | 1 | 116 |
Contrary to my memory, Robinson's 3-man rushes were kind of effective by this simple win/loss method. Everything else was flipping a coin.
I counted this as sending five; Gordon was covering the RB and
stepped up when he saw his man was in pass pro.
Mattison in 2011:
| Rushed: | 2 | 3 | 4 | 5 | 6 | 7 | Total |
|---|---|---|---|---|---|---|---|
| Win | - | 2 | 27 | 20 | 8 | 2 | 59 |
| Loss | - | 5 | 30 | 14 | 6 | 55 |
He's definitely sending more guys. Effectiveness seems to be..wait, down?:
| Rushed: | 3 | 4 | 5 | 6 | 7 | Total |
|---|---|---|---|---|---|---|
| GERG | 58.7% | 46.2% | 58.1% | 52.6% | 75.0% | 54.0% |
| Mattison | 28.6% | 47.4% | 58.8% | 57.1% | 100.0% | 51.8% |
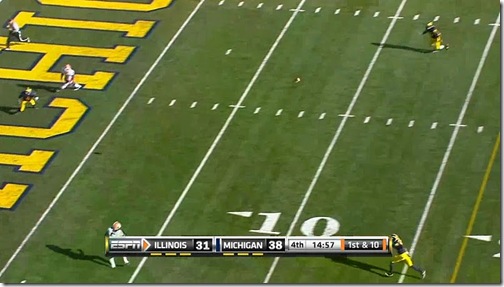
AAHHHHHHH this isn't right. This can't be right. Well for one Mattison barely ever sends three. He did it once versus SDSU, and that when Michigan was up 28-7 with 5 minutes left in the 4th quarter. It went for 15 yards. However when I look at the wins and losses when the game is within 8 points it's still way favoring GERG:
| Coach | Win | Loss | Total |
|---|---|---|---|
| GERG | 100 | 77 | 177 |
| Mattison | 18 | 29 | 47 |
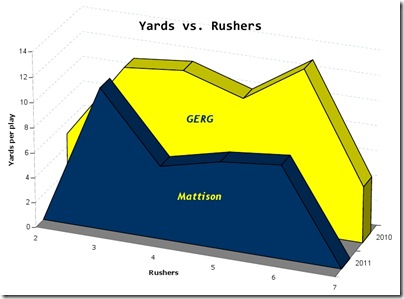
AHHHHHHH. This is literally not what I expected. Maybe my Wins and Losses thing is just stupid. Let's do this by simple yards per play when Michigan rushes…
| Rushed: | 2 | 3 | 4 | 5 | 6 | 7 | Total |
|---|---|---|---|---|---|---|---|
| GERG | 5.0 | 7.7 | 9.1 | 6.2 | 8.3 | 2.3 | 8.0 |
| Mattison | 11.3 | 5.2 | 5.4 | 5.2 | - | 5.5 |
And there you see it. I may have found what's throwing me off here. The Pass/Fail nature of my system was not showing that when GERG's defense failed, it failed BIG. Look what happens to yards per pass when I only count the "Loss" plays:
| Rush 3 | Rush 4 | Rush 5 | Rush 6 | Rush 7 | |
|---|---|---|---|---|---|
| GERG | 16.5 | 14.8 | 16.6 | 19.3 | 19.0 |
| Mattison | 13.6 | 10.8 | 12.7 | 11.8 | - |
When the 2010 pass defense failed, it didn't just give up the first down, but often a good chunk afterwards. The 2011 defense is still 50/50 to get the job done on any given passing play, but at least they're living to see the next series more often than not. That means more chances per drive for a turnover.
Last bit, just to see if this is changing running stats:
| Rush YPC | Rush YPG | Rush TDs/Game | Pass TDs/game | |
|---|---|---|---|---|
| 2010 (All of it) | 4.4 | 188.9 | 2.6 | 1.6 |
| 2011 (4 games) | 4.7 | 156.0 | 0.5 | 1.0 |
Er. My expectation here was that Rushing YPC would be way down due to an extra rusher being around when a running play is called, but they're actually up a good bit. However the TDs given up are way way down. That combined with not once have we seen a freshman corner vacate his zone in dime, and this defense looks like it's already at mediocre and learning things that might make them good.
Holding this to 15 yards maybe should be a win.
Draw a Conclusion: Mattison hasn't even faced the best teams on his schedule yet so I can't claim anything is better or fixed. What I can say is the theory that the huge flip in turnover margin this year and/or improved defensive back play is probably having a bigger effect on Michigan's apparent defensive improvement than line scheme/aggressiveness. The data are way too close and inconclusive to draw anything for certain, and four games is not enough to assess, especially considering it's the first four games with this defense. But it is kind of interesting to see that rushing the extra guy seems to be doing a better job of keeping down the big plays than having eight men in coverage. That was really unexpected, though again it probably has a lot more to do with the efficacy of the specific defensive backs in coverage more than scheme.
------------------------------------------------------------------------
Bonus: here's how they do on each down:
| 1st | 2nd | 3rd | 4th | |
|---|---|---|---|---|
| GERG | 50.57% | 56.47% | 57.53% | 28.57% |
| Mattison | 48.98% | 48.65% | 57.69% | 100.00% |


70