2014 is not 2013

Gardner's implied question is the same we're all asking [Fuller]
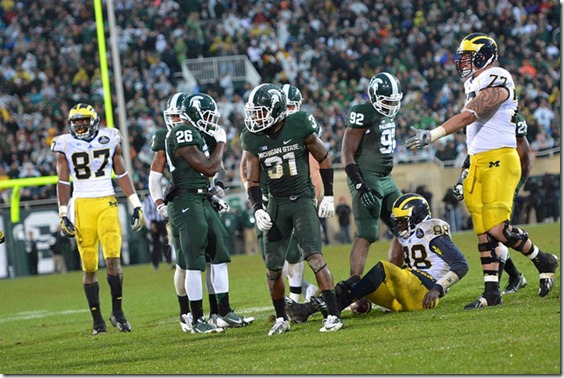
The 2014 football season hinges on whether the offensive line can go from one of the worst in the country to just mediocre. We've mentioned the downsides: it has to replace two NFL tackles. The upside is an offensive coordinator who plans to simplify the things they'll have to do, a ton of talent, and rather good excuses for why the bulk of guys weren't so good (youth compounded by panicky/insane coaching decisions). The competence of coaches replaced, arriving, or remaining can't be determined until they play, so guesses at their 2014 performance have to be extrapolated from what we know of the current players and the typical progression of men like them.
When Michigan was still putting together those 2012 and 2013 classes I looked over the history of our offensive linemen going back to the mid-'90s, because my memory before that is weak.
| Status | Year in program | ||||
|---|---|---|---|---|---|
| 1st | 2nd | 3rd | 4th | 5th | |
| All-B1G+ | - | - | 1 | 10 | 12 |
| Solid Starter | 1 | 8 | 14 | 10 | 13 |
| Liability Starter | 1 | 3 | 8 | 12 | 6 |
| Backup | 0 | 50 | 30 | 17 | 8 |
| Redshirting | 75 | - | - | - | - |
| Injured | 0 | 6 | 3 | 2 | - |
| Playing defense | 2 | 1 | 1 | - | - |
| Not on team | 1 | 6 | 13 | 17 | 29 |
| % Available | 99% | 92% | 81% | 75% | 57% |
| % Solid + | 1% | 11% | 21% | 29% | 37% |
| % All-B1G+ | - | - | 1% | 15% | 18% |
Really it's more specific than the above. If you're the backup to Steve Hutchinson in 2000 you could be pretty solid or terrible, but if you were an interior lineman on the 2013 team and hale and still couldn't crack the depth chart, you were obviously not good at that point. One thing working in our favor is Michigan has historically brought in offensive line classes rated about as highly as the recent crops. If you tried this with MSU over the same period there would be stretches of 2-stars (and, um, personal issues) to throw off the numbers.
A more precise way to show where our OL are at this point is to find closer comparisons to historic players at this point in their careers. I couldn't figure out a good way to show "tracks" before, but I think I've learned enough about table html now to make a crude flow chart. Sample sizes are way too small to say "Kalis will be X good by Y season," but if you can read it to say "At that age, Steve Schilling and Patrick Omameh were both about where Kalis is now." Usefulness is better at capping expectations: you can always say so-and-so was a backup at this point, but Miller's not going to be Molk.
Here goes:
| Freshman(True) | Fr/So | So/Jr | Jr/Sr | Sr 5th | Players |
|---|---|---|---|---|---|
| Solid | Solid | x | x | n/a | Justin Boren |
| Liability Bosch, (Cole?) | ? | ? | ? | ? | ? |
| Defense | Backup | Backup | Star | n/a | Maurice Williams, Damon Denson |
| Not on team (x) | TransferRS | Backup | Solid | Star | Jonathan Goodwin |
| Redshirted | Solid | Star | Star | Star | David Molk |
| Solid | Star | Star | Jansen, Hutchinson, Backus, Long, Lewan | ||
| Liability Kalis, Magnuson | Liability | Solid | Solid | Steven Schilling | |
| Solid | Liability | Liability | Patrick Omameh | ||
| Backup | Solid Glasgow | Star | Star | David Brandt, David Baas | |
| Solid | Star | Tony Pape, Adam Kraus, Schofield | |||
| Solid | Stenavich, Lentz | ||||
| Liability Miller | Solid | Star | Zach Adami | ||
| Injured | Solid | Chris Ziemann | |||
| Liability | Solid | Mark Huyge | |||
| Liability | Reuben Riley | ||||
| x | Alex Mitchell | ||||
| Backup | Backup | Demeterius Solomon | |||
| Backup | Solid | Solid | Dave Pearson | ||
| Liability | Ricky Barnum | ||||
| Liability | Solid | Frazier, Petruziello, Bihl, Ortmann | |||
| Liability | David Moosman, Perry Dorrestein | ||||
| Backup | Ben Mast, Courtney Morgan | ||||
| Backup | Solid | Kurt Anderson, Leo Henige | |||
| Liability | Elliott Mealer | ||||
| Backup | N. Parker, Denay, Kolodziej, McAvoy | ||||
| Unrenewed | Partchenko, Potts, Christopfel, Gaston, DeBenedictis, Ciulla, Gallimore, Khoury | ||||
| Defense | Backup | Backup | John Ferrara | ||
| Injuries | Zirbel, Mossa, Sharrow, Brooks, Schifano, C. Bryant, Tannous, A.Brown, Simelis, Berishaj, C.Pace | ||||
| Transfers | Ries, Moltane, Zuttah, Wermers, O'Neill, Posada | ||||
[Discussion after the jump]
This hurt. [Fuller]
Longtime readers will know the MGoBlog policy on sacking: sacks and sack yardage should be counted as passing, because they are pass plays, not rushing, as the NCAA and thus everybody else is wont to do. Counting sacks as passing leads to a better understanding of success and where yards come from, and prevents problems like the computer in the NCAA videogames passing every play because the sacks that generates keep making the rushing numbers look progressively more awful.
For the Hail to the Victors preview books (kickstarter coming soon) each year we put these "At-a-Glance" boxes into the opponent previews, complete with offensive and defensive stats that we've adjusted for this. Having done the calculations for that, I thought I'd share them with you.
First, the difference it makes to passing stats:
| 2013 Passing | Unadjusted | Sack-Adjusted | ||||||||
|---|---|---|---|---|---|---|---|---|---|---|
| Team | Pass Att | Pass Yds | YPA | Rk | Sacks | Sack Yds | YPA | Rk | ||
| Indiana | 470 | 3680 | 7.83 | 2nd | 18 | 121 | 7.29 | 1st | ||
| Ohio State | 368 | 2846 | 7.73 | 3rd | 22 | 135 | 6.95 | 2nd | ||
| Penn State | 409 | 3110 | 7.60 | 4th | 22 | 135 | 6.90 | 3rd | ||
| Michigan | 395 | 3221 | 8.15 | 1st | 36 | 270 | 6.85 | 4th | ||
| Wisconsin | 355 | 2562 | 7.22 | 6th | 16 | 94 | 6.65 | 5th | ||
| Illinois | 455 | 3452 | 7.59 | 5th | 30 | 231 | 6.64 | 6th | ||
| Iowa | 375 | 2562 | 6.83 | 10th | 15 | 61 | 6.41 | 7th | ||
| Michigan State | 430 | 2964 | 6.89 | 9th | 17 | 127 | 6.35 | 8th | ||
| Nebraska | 378 | 2557 | 6.76 | 11th | 17 | 140 | 6.12 | 9th | ||
| Northwestern | 382 | 2726 | 7.14 | 8th | 36 | 198 | 6.05 | 10th | ||
| Minnesota | 267 | 1925 | 7.21 | 7th | 27 | 170 | 5.97 | 11th | ||
| Purdue | 426 | 2590 | 6.08 | 12th | 38 | 265 | 5.01 | 12th | ||
By counting sacks as passing Michigan drops from 8.15 yards per attempt (good for the best passing team in the conference last year) to a more realistic 6.85 YPA, dropping them to fourth. Minnesota's passing game dropped from middling to awful, Iowa's climbed from the bottom to the middle.
And the difference to running stats:
| 2013 Rushing | Unadjusted | Sack-Adjusted | ||||||||
|---|---|---|---|---|---|---|---|---|---|---|
| Team | Rushes | Rush Yds | YPC | Rk | Sacks | Sack Yds | YPA | Rk | ||
| Ohio State | 635 | 4321 | 6.80 | 1st | 22 | 135 | 7.27 | 1st | ||
| Wisconsin | 557 | 3689 | 6.62 | 2nd | 16 | 94 | 6.99 | 2nd | ||
| Indiana | 458 | 2422 | 5.29 | 3rd | 18 | 121 | 5.78 | 3rd | ||
| Nebraska | 584 | 2804 | 4.80 | 4th | 17 | 140 | 5.19 | 4th | ||
| Illinois | 411 | 1668 | 4.06 | 10th | 30 | 231 | 4.98 | 5th | ||
| Minnesota | 586 | 2538 | 4.33 | 5th | 27 | 170 | 4.84 | 6th | ||
| Northwestern | 507 | 2069 | 4.08 | 9th | 36 | 198 | 4.81 | 7th | ||
| Penn State | 501 | 2088 | 4.17 | 8th | 22 | 135 | 4.64 | 8th | ||
| Michigan State | 569 | 2433 | 4.28 | 6th | 17 | 127 | 4.64 | 9th | ||
| Iowa | 556 | 2338 | 4.21 | 7th | 15 | 61 | 4.43 | 10th | ||
| Michigan | 498 | 1634 | 3.28 | 11th | 36 | 270 | 4.12 | 11th | ||
| Purdue | 319 | 805 | 2.52 | 12th | 38 | 265 | 3.81 | 12th | ||
Michigan's awful running game is still awful, but it no longer looks like the Scheelhaase option-running game was a disaster. Ohio State's 7.27 YPC isn't just first among the conference; OSU and Wisconsin were the #1 and #2 rushing offenses in the country. Michigan: 115th out of 125 teams.
This isn't perfect since quarterback scrambles still can't be pulled out of rushing stats, but that's not so big of a deal considering a running QB should be contributing to your rushing success.
[Jump for Devin Garder's passing season and profiles of next year's opponents]
Non-Conference Opponents
RPI Effect Only Teams:
UMass-Lowell (5-14) Beat Maine, but lost to New Hampshire. I’m assuming this was hockey. Houston Baptist (4-12) had a rough Bayou-centric week, losing home games to New Orleans and Southeastern Louisiana. At this point, you probably aren’t even reading this section because who cares. But I’m still writing. South Carolina State (7-13) beat Norfolk State, but lost to Hampton. I’m tempted to call this section “a tree falling on a blog when a 402 error knocks out the servers.” Coppin State (7-13) lost to North Carolina Central, but beat North Carolina A&T, and are a middle-of-the-pack MEAC team, which is probably best-case scenario.
Long Beach State (7-12) beat Cal State Northridge. Purple monkey dishwasher. Holy Cross (11-9) is on a four game winning streak, beating Lafayette and Navy. Inflammable and flammable mean the same thing. Charlotte (12-7) lost to Louisiana Tech and Rice, though given the last week, Michigan’s loss to the 49ers has shifted from “resume anchor” toward “amusing anomaly indicating the unpredictable nature of sports.” Resume. Résumé. Ah, better. Vive Napoleon! Allons enfants de la patrie, le jour de gloire est arrivé.
Big Sorts of Teams
#16 Iowa State (15-4, 3-4 Big 12)
This week: Beat Kansas State (81-75); Lost to Kansas (92-81)
Somehow, the bracket gurus still have Iowa State as a 4-seed. You figure it out.
Florida State (13-6, 4-2 ACC)
This week: Lost to Duke (Many-Few); Lost @ NC State (74-70)
Yikes, this week. Florida State has fought its way down to the bubble. For some reason, they have been terrible on the defensive glass; they’re dead last in the ACC, losing 40.8% of rebounds to their conference opponents. I wonder if this will come into play against…
#23 Dook (17-4, 6-2 ACC)
This week: Splattered Florida State (78-56); Beat Pitt (80-65)
Duke is hitting on all cylinders, beating KenPom’s #13 and #22 teams by a combined 37 points, with the 15 point win over #13 Pitt coming on the road. In possibly the most amazing stat I have seen all year, Duke grabbed 27 OFFENSIVE rebounds (to FSU’s 24 TOTAL rebounds). That is an OR% of 61.4%. A Duke miss was way more likely to end in Duke hands than in Seminole hands. And FSU, as I have been reminding you weekly, is huge. Jabari Parker had 10 offensive boards. That is how you beat a quality opponent by 22 despite shooting 10-39 (25.6%) from INSIDE the arc. Mind: bottled.
#1 Arizona (21-0, 8-0 PAC 12)
This week: Beat Colorado (69-57); Beat Utah (65-56); Beat Stanford (60-57)
Arizona is going to walk away with the PAC 12, and could probably sleepwalk into a 1-seed. So nothing has changed.
Stanford (13-7, 4-4 PAC 12)
This week: Lost to UCLA (91-74); Beat USC (79-71 OT); Lost to Arizona (60-57)
Stanford is riiiiiiiight on the bubble right now, and a win over Arizona would have been worth an incredible amount to the committee. They’ve still got a shot, but their golden ticket may have just escaped.
[The Big Ten after the Jump]


41